Smarzhevskiy Ivan
Personal homepagehttps://www.facebook.com/ivsmrudn/
Professional homepage ORCID more infohttps://orcid.org/0000-0002-5279-7627
GitHub more info
Smarzhevskiy Ivan, born 1961, graduated from the Faculty of Mechanics and Mathematics of Moscow State University in 1983. Ph.D. in Economic Sciences since 2000.
Research interests: individual and collective behavior in the organization, decision making, sociology of small groups.
Research Interests
decision making, sociology of small groups, agent based models
Peer reviewed Organizational behavior in the hierarchy model
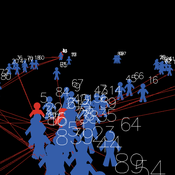
Smarzhevskiy Ivan | Published Tuesday, June 18, 2019 | Last modified Wednesday, July 31, 2019In a two-level hierarchical structure (consisting of the positions of managers and operators), persons holding these positions have a certain performance and the value of their own (personal perception in this, simplified, version of the model) perception of each other. The value of the perception of each other by agents is defined as a random variable that has a normal distribution (distribution parameters are set by the control elements of the interface).
In the world of the model, which is the space of perceptions, agents implement two strategies: rapprochement with agents that perceive positively and distance from agents that perceive negatively (both can be implemented, one of these strategies, or neither, the other strategy, which makes the agent stationary). Strategies are implemented in relation to those agents that are in the radius of perception (PerRadius).
The manager (Head) forms a team of agents. The performance of the group (the sum of the individual productivities of subordinates, weighted by the distance from the leader) varies depending on the position of the agents in space and the values of their individual productivities. Individual productivities, in the current version of the model, are set as a random variable distributed evenly on a numerical segment from 0 to 100. The manager forms the team 1) from agents that are in (organizational) radius (Op_Radius), 2) among agents that the manager perceives positively and / or negatively (both can be implemented, one of the specified rules, or neither, which means the refusal of the command formation).
Agents can (with a certain probability, given by the variable PrbltyOfDecisn%), in case of a negative perception of the manager, leave his group permanently.
It is possible in the model to change on the fly radii values, update the perception value across the entire population and the perception of an individual agent by its neighbors within the perception radius, and the probability values for a subordinate to make a decision about leaving the group.
You can also change the set of strategies for moving agents and strategies for recruiting a team manager. It is possible to add a randomness factor to the movement of agents (Stoch_Motion_Speed, the default is set to 0, that is, there are no random movements).
…
Peer reviewed Garbage can model NetLogo implementation
Smarzhevskiy Ivan | Published Sunday, February 14, 2016 | Last modified Tuesday, July 30, 2019It is NetLogo reconstruction of the original FORTRAN code of the classical M. Cohen, J. March, and J. Olsen “garbage can model” (GCM or CMO) of collective decision-making.
Peer reviewed Garbage can model Excel reconstruction
Smarzhevskiy Ivan | Published Tuesday, August 19, 2014 | Last modified Tuesday, July 30, 2019Reconstruction of the original code M. Cohen, J. March, and J. Olsen garbage can model, realized by means of Microsoft Office Excel 2010
Peer reviewed Personnel decisions in the hierarchy
Smarzhevskiy Ivan | Published Friday, August 19, 2022This is a model of organizational behavior in the hierarchy in which personnel decisions are made.
The idea of the model is that the hierarchy, busy with operations, is described by such characteristics as structure (number and interrelation of positions) and material, filling these positions (persons with their individual performance). A particular hierarchy is under certain external pressure (performance level requirement) and is characterized by the internal state of the material (the distribution of the perceptions of others over the ensemble of persons).
The World of the model is a four-level hierarchical structure, consisting of shuff positions of the top manager (zero level of the hierarchy), first-level managers who are subordinate to the top manager, second-level managers (subordinate to the first-level managers) and positions of employees (the third level of the hierarchy). ) subordinated to the second-level managers. Such a hierarchy is a tree, i.e. each position, with the exception of the position of top manager, has a single boss.
Agents in the model are persons occupying the specified positions, the number of persons is set by the slider (HumansQty). Personas have some operational performance (harisma, an unfortunate attribute name left over from the first edition of the model)) and a sense of other personas’ own perceptions. Performance values are distributed over the ensemble of persons according to the normal law with some mean value and variance.
The value of perception by agents of each other is positive or negative (implemented in the model as numerical values equal to +1 and -1). The distribution of perceptions over an ensemble of persons is implemented as a random variable specified by the probability of negative perception, the value of which is set by the control elements of the model interface. The numerical value of the probability equal to 0 corresponds to the case in which all persons positively perceive each other (the numerical value of the random variable is equal to 1, which corresponds to the positive perception of the other person by the individual).
The hierarchy is occupied with operational activity, the degree of intensity of which is set by the external parameter Difficulty. The level of productivity of each manager OAIndex is equal to the level of productivity of the department he leads and is the ratio of the sum of productivity of employees subordinate to the head to the level of complexity of the work Difficulty. An increase in the numerical value of Difficulty leads to a decrease in the OAIndex for all subdivisions of the hierarchy. The managerial meaning of the OAIndex indicator is the percentage of completion of the load specified for the hierarchy as a whole, i.e. the ratio of the actual performance of the structural subdivisions of the hierarchy to the required performance, the level of which is specified by the value of the Difficulty parameter.
…
Peer reviewed NetLogo model of USA mass shootings
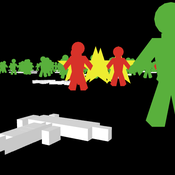
Smarzhevskiy Ivan | Published Tuesday, September 24, 2019 | Last modified Tuesday, April 14, 2020Is the mass shooter a maniac or a relatively normal person in a state of great stress? According to the FBI report (Silver, J., Simons, A., & Craun, S. (2018). A Study of the Pre-Attack Behaviors of Active Shooters in the United States Between 2000 – 2013. Federal Bureau of Investigation, U.S. Department of Justice,Washington, D.C. 20535.), only 25% of the active shooters were known to have been diagnosed by a mental health professional with a mental illness of any kind prior to the offense.
The main objects of the model are the humans and the guns. The main factors influencing behavior are the population size, the number of people with mental disabilities (“psycho” in the model terminology) per 100,000 population, the total number of weapons (“guns”) in the population, the availability of guns for humans, the intensity of stressors affecting humans and the threshold level of stress, upon reaching which a person commits an act of mass shooting.
The key difference (in the model) between a normal person and a psycho is that a psycho accumulates stressors and, upon reaching a threshold level, commits an act of mass shooting. A normal person is exposed to stressors, but reaching the threshold level for killing occurs only when the simultaneous effect of stressors on him exceeds this level.
The population dynamics are determined by the following factors: average (normally distributed) life expectancy (“life_span” attribute of humans) and population growth with the percentage of newborns set by the value of the TickReprRatio% slider of the current population volume from 16 to 45 years old.Thus, one step of model time corresponds to a year.
Model of communication between two groups of managers in the course of project implementation
Smarzhevskiy Ivan | Published Monday, December 07, 2020This is a simulation model of communication between two groups of managers in the course of project implementation. The “world” of the model is a space of interaction between project participants, each of which belongs either to a group of work performers or to a group of customers. Information about the progress of the project is publicly available and represents the deviation Earned value (EV) from the planned project value (cost baseline).
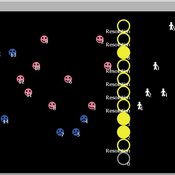
The key elements of the model are 1) persons belonging to a group of customers or performers, 2) agents that are communication acts. The life cycle of persons is equal to the time of the simulation experiment, the life cycle of the communication act is 3 periods of model time (for the convenience of visualizing behavior during the experiment). The communication act occurs at a specific point in the model space, the coordinates of which are realized as random variables. During the experiment, persons randomly move in the model space. The communication act involves persons belonging to a group of customers and a group of performers, remote from the place of the communication act at a distance not exceeding the value of the communication radius (MaxCommRadius), while at least one representative from each of the groups must participate in the communication act. If none are found, the communication act is not carried out. The number of potential communication acts per unit of model time is a parameter of the model (CommPerTick).
The managerial sense of the feedback is the stimulating effect of the positive value of the accumulated communication complexity (positive background of the project implementation) on the productivity of the performers. Provided there is favorable communication (“trust”, “mutual understanding”) between the customer and the contractor, it is more likely that project operations will be performed with less lag behind the plan or ahead of it.
The behavior of agents in the world of the model (change of coordinates, visualization of agents’ belonging to a specific communicative act at a given time, etc.) is not informative. Content data are obtained in the form of time series of accumulated communicative complexity, the deviation of the earned value from the planned value, average indicators characterizing communication - the total number of communicative acts and the average number of their participants, etc. These data are displayed on graphs during the simulation experiment.
The control elements of the model allow seven independent values to be varied, which, even with a minimum number of varied values (three: minimum, maximum, optimum), gives 3^7 = 2187 different variants of initial conditions. In this case, the statistical processing of the results requires repeated calculation of the model indicators for each grid node. Thus, the set of varied parameters and the range of their variation is determined by the logic of a particular study and represents a significant narrowing of the full set of initial conditions for which the model allows simulation experiments.
…
Under development.


