About the CoMSES Model Library more info
Our mission is to help computational modelers at all levels engage in the establishment and adoption of community standards and good practices for developing and sharing computational models. Model authors can freely publish their model source code in the Computational Model Library alongside narrative documentation, open science metadata, and other emerging open science norms that facilitate software citation, reproducibility, interoperability, and reuse. Model authors can also request peer review of their computational models to receive a DOI.
All users of models published in the library must cite model authors when they use and benefit from their code.
Please check out our model publishing tutorial and contact us if you have any questions or concerns about publishing your model(s) in the Computational Model Library.
We also maintain a curated database of over 7500 publications of agent-based and individual based models with additional detailed metadata on availability of code and bibliometric information on the landscape of ABM/IBM publications that we welcome you to explore.
Displaying 10 of 25 results productivity clear search
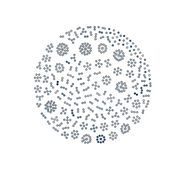
Peer reviewed Evolution of Conditional Cooperation in a Spatial Public Goods Game
Francesca Federico Raksha Balakrishna Marco Janssen | Published Saturday, March 15, 2025A model to investigate the Evolution of Conditional Cooperation in a Spatial Public Goods Game. We consider two conditional cooperation strategies: one based on thresholds (Battu & Srinivasan, 2020) and another based on independent decisions for each number of cooperating neighbors. We examine the effects of productivity and conditional cooperation criteria on the trajectory of cooperation. Cooperation is evolving with no need for additional mechanisms apart from spatial structure when agents follow conditional strategies. We confirm the positive influence of productivity and cluster formation on the evolution of cooperation in spatial models. Results are robust for the two types of conditional cooperation strategies.
Peer reviewed COMMONSIM: Simulating the utopia of COMMONISM
Lena Gerdes Manuel Scholz-Wäckerle Ernest Aigner Stefan Meretz Hanno Pahl Annette Schlemm Jens Schröter Simon Sutterlütti | Published Sunday, November 05, 2023This research article presents an agent-based simulation hereinafter called COMMONSIM. It builds on COMMONISM, i.e. a large-scale commons-based vision for a utopian society. In this society, production and distribution of means are not coordinated via markets, exchange, and money, or a central polity, but via bottom-up signalling and polycentric networks, i.e. ex-ante coordination via needs. Heterogeneous agents care for each other in life groups and produce in different groups care, environmental as well as intermediate and final means to satisfy sensual-vital needs. Productive needs decide on the magnitude of activity in groups for a common interest, e.g. the production of means in a multi-sectoral artificial economy. Agents share cultural traits identified by different behaviour: a propensity for egoism, leisure, environmentalism, and productivity. The narrative of this utopian society follows principles of critical psychology and sociology, complexity and evolution, the theory of commons, and critical political economy. The article presents the utopia and an agent-based study of it, with emphasis on culture-dependent allocation mechanisms and their social and economic implications for agents and groups.
Peer reviewed Organizational behavior in the hierarchy model
Smarzhevskiy Ivan | Published Tuesday, June 18, 2019 | Last modified Wednesday, July 31, 2019In a two-level hierarchical structure (consisting of the positions of managers and operators), persons holding these positions have a certain performance and the value of their own (personal perception in this, simplified, version of the model) perception of each other. The value of the perception of each other by agents is defined as a random variable that has a normal distribution (distribution parameters are set by the control elements of the interface).
In the world of the model, which is the space of perceptions, agents implement two strategies: rapprochement with agents that perceive positively and distance from agents that perceive negatively (both can be implemented, one of these strategies, or neither, the other strategy, which makes the agent stationary). Strategies are implemented in relation to those agents that are in the radius of perception (PerRadius).
The manager (Head) forms a team of agents. The performance of the group (the sum of the individual productivities of subordinates, weighted by the distance from the leader) varies depending on the position of the agents in space and the values of their individual productivities. Individual productivities, in the current version of the model, are set as a random variable distributed evenly on a numerical segment from 0 to 100. The manager forms the team 1) from agents that are in (organizational) radius (Op_Radius), 2) among agents that the manager perceives positively and / or negatively (both can be implemented, one of the specified rules, or neither, which means the refusal of the command formation).
Agents can (with a certain probability, given by the variable PrbltyOfDecisn%), in case of a negative perception of the manager, leave his group permanently.
It is possible in the model to change on the fly radii values, update the perception value across the entire population and the perception of an individual agent by its neighbors within the perception radius, and the probability values for a subordinate to make a decision about leaving the group.
You can also change the set of strategies for moving agents and strategies for recruiting a team manager. It is possible to add a randomness factor to the movement of agents (Stoch_Motion_Speed, the default is set to 0, that is, there are no random movements).
…
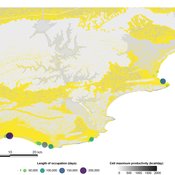
Peer reviewed The foraging potential of the Holocene Cape South Coast of South Africa without the Palaeo-Agulhas Plain
Colin Wren Marco Janssen | Published Monday, August 12, 2019The Palaeo-Agulhas Plain formed an important habitat exploited by Pleistocene hunter-gatherer populations during periods of lower sea level. This productive, grassy habitat would have supported numerous large-bodied ungulates accessible to a population of skilled hunters with the right hunting technology. It also provided a potentially rich location for plant food collection, and along its shores a coastline that moved with the rise and fall of sea levels. The rich archaeological and paleontological records of Pleistocene sites along the modern Cape south coast of South Africa, which would have overlooked the Palaeo-Agulhas Plain during Pleistocene times of lower sea level, provides a paleoarchive of this extinct ecosystem. In this paper, we present a first order illustration of the “palaeoscape modeling” approach advocated by Marean et al. (2015). We use a resourcescape model created from modern studies of habitat productivity without the Palaeo-Agulhas Plain. This is equivalent to predominant Holocene conditions. We then run an agent-based model of the human foraging system to investigate several research questions. Our agent-based approach uses the theoretical framework of optimal foraging theory to model human foraging decisions designed to optimize the net caloric gains within a complex landscape of spatially and temporally variable resources. We find that during the high sea-levels of MIS 5e (+5-6 m asl) and the Holocene, the absence of the Plain left a relatively poor food base supporting a much smaller population relying heavily on edible plant resources from the current Cape flora. Despite high species diversity of plants with edible storage organs, and marine invertebrates, encounter rates with highly profitable resources were low. We demonstrate that without the Palaeo-Agulhas Plain, human populations must have been small and low density, and exploited plant, mammal, and marine resources with relatively low caloric returns. The exposure and contraction of the Palaeo-Agulhas Plain was likely the single biggest driver of behavioral change during periods of climate change through the Pleistocene and into the transition to the Holocene.
Peer reviewed Personnel decisions in the hierarchy
Smarzhevskiy Ivan | Published Friday, August 19, 2022This is a model of organizational behavior in the hierarchy in which personnel decisions are made.
The idea of the model is that the hierarchy, busy with operations, is described by such characteristics as structure (number and interrelation of positions) and material, filling these positions (persons with their individual performance). A particular hierarchy is under certain external pressure (performance level requirement) and is characterized by the internal state of the material (the distribution of the perceptions of others over the ensemble of persons).
The World of the model is a four-level hierarchical structure, consisting of shuff positions of the top manager (zero level of the hierarchy), first-level managers who are subordinate to the top manager, second-level managers (subordinate to the first-level managers) and positions of employees (the third level of the hierarchy). ) subordinated to the second-level managers. Such a hierarchy is a tree, i.e. each position, with the exception of the position of top manager, has a single boss.
Agents in the model are persons occupying the specified positions, the number of persons is set by the slider (HumansQty). Personas have some operational performance (harisma, an unfortunate attribute name left over from the first edition of the model)) and a sense of other personas’ own perceptions. Performance values are distributed over the ensemble of persons according to the normal law with some mean value and variance.
The value of perception by agents of each other is positive or negative (implemented in the model as numerical values equal to +1 and -1). The distribution of perceptions over an ensemble of persons is implemented as a random variable specified by the probability of negative perception, the value of which is set by the control elements of the model interface. The numerical value of the probability equal to 0 corresponds to the case in which all persons positively perceive each other (the numerical value of the random variable is equal to 1, which corresponds to the positive perception of the other person by the individual).
The hierarchy is occupied with operational activity, the degree of intensity of which is set by the external parameter Difficulty. The level of productivity of each manager OAIndex is equal to the level of productivity of the department he leads and is the ratio of the sum of productivity of employees subordinate to the head to the level of complexity of the work Difficulty. An increase in the numerical value of Difficulty leads to a decrease in the OAIndex for all subdivisions of the hierarchy. The managerial meaning of the OAIndex indicator is the percentage of completion of the load specified for the hierarchy as a whole, i.e. the ratio of the actual performance of the structural subdivisions of the hierarchy to the required performance, the level of which is specified by the value of the Difficulty parameter.
…
Peer reviewed Emergent Firms Model
J M Applegate | Published Friday, July 13, 2018The Emergent Firm (EF) model is based on the premise that firms arise out of individuals choosing to work together to advantage themselves of the benefits of returns-to-scale and coordination. The Emergent Firm (EF) model is a new implementation and extension of Rob Axtell’s Endogenous Dynamics of Multi-Agent Firms model. Like the Axtell model, the EF model describes how economies, composed of firms, form and evolve out of the utility maximizing activity on the part of individual agents. The EF model includes a cash-in-advance constraint on agents changing employment, as well as a universal credit-creating lender to explore how costs and access to capital affect the emergent economy and its macroeconomic characteristics such as firm size distributions, wealth, debt, wages and productivity.
Peer reviewed BAM: The Bottom-up Adaptive Macroeconomics Model
Alejandro Guerra-Hernández Alejandro Platas López | Published Tuesday, January 14, 2020 | Last modified Sunday, July 26, 2020Overview
Purpose
Modeling an economy with stable macro signals, that works as a benchmark for studying the effects of the agent activities, e.g. extortion, at the service of the elaboration of public policies..
…
This paper presents an agent-based model to study the dynamics of city-state systems in a constrained environment with limited space and resources. The model comprises three types of agents: city-states, villages, and battalions, where city-states, the primary decision-makers, can build villages for food production and recruit battalions for defense and aggression. In this setting, simulation results, generated through a multi-parameter grid sampling, suggest that risk-seeking strategies are more effective in high-cost scenarios, provided that the production rate is sufficiently high. Also, the model highlights the role of output productivity in defining which strategic preferences are successful in a long-term scenario, with higher outputs supporting more aggressive expansion and military actions, while resource limitations compel more conservative strategies focused on survival and resource conservation. Finally, the results suggest the existence of a non-linear effect of diminishing returns in strategic investments on successful strategies, emphasizing the need for careful resource allocation in a competitive environment.
PaleoscapeABM: coastal occupation and shellfish discard
Claudine Gravel-Miguel | Published Tuesday, February 08, 2022This model builds on the Armature distribution within the PaleoscapeABM model, which is itself a variant of the PaleoscapeABM available here written by Wren and Janssen, and.
This model aims to explore where and how much shellfish is discarded at coastal and non-coastal locations by daily coastal foraging. We use this model’s output to test the idea that we can confidently use the archaeological record to evaluate the importance of shellfish in prehistoric people’s diets.
The recognition that aquatic adaptations likely had significant impacts on human evolution triggered an explosion of research on that topic. Recognizing coastal foraging in the past relies on the archaeological signature of that behavior. We use this model to explore why some coastal sites are very intensely occupied and see if it is due to the shellfish productivity of the coast.
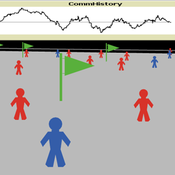
Model of communication between two groups of managers in the course of project implementation
Smarzhevskiy Ivan | Published Monday, December 07, 2020This is a simulation model of communication between two groups of managers in the course of project implementation. The “world” of the model is a space of interaction between project participants, each of which belongs either to a group of work performers or to a group of customers. Information about the progress of the project is publicly available and represents the deviation Earned value (EV) from the planned project value (cost baseline).
The key elements of the model are 1) persons belonging to a group of customers or performers, 2) agents that are communication acts. The life cycle of persons is equal to the time of the simulation experiment, the life cycle of the communication act is 3 periods of model time (for the convenience of visualizing behavior during the experiment). The communication act occurs at a specific point in the model space, the coordinates of which are realized as random variables. During the experiment, persons randomly move in the model space. The communication act involves persons belonging to a group of customers and a group of performers, remote from the place of the communication act at a distance not exceeding the value of the communication radius (MaxCommRadius), while at least one representative from each of the groups must participate in the communication act. If none are found, the communication act is not carried out. The number of potential communication acts per unit of model time is a parameter of the model (CommPerTick).
The managerial sense of the feedback is the stimulating effect of the positive value of the accumulated communication complexity (positive background of the project implementation) on the productivity of the performers. Provided there is favorable communication (“trust”, “mutual understanding”) between the customer and the contractor, it is more likely that project operations will be performed with less lag behind the plan or ahead of it.
The behavior of agents in the world of the model (change of coordinates, visualization of agents’ belonging to a specific communicative act at a given time, etc.) is not informative. Content data are obtained in the form of time series of accumulated communicative complexity, the deviation of the earned value from the planned value, average indicators characterizing communication - the total number of communicative acts and the average number of their participants, etc. These data are displayed on graphs during the simulation experiment.
The control elements of the model allow seven independent values to be varied, which, even with a minimum number of varied values (three: minimum, maximum, optimum), gives 3^7 = 2187 different variants of initial conditions. In this case, the statistical processing of the results requires repeated calculation of the model indicators for each grid node. Thus, the set of varied parameters and the range of their variation is determined by the logic of a particular study and represents a significant narrowing of the full set of initial conditions for which the model allows simulation experiments.
…
Displaying 10 of 25 results productivity clear search