About the CoMSES Model Library more info
Our mission is to help computational modelers at all levels engage in the establishment and adoption of community standards and good practices for developing and sharing computational models. Model authors can freely publish their model source code in the Computational Model Library alongside narrative documentation, open science metadata, and other emerging open science norms that facilitate software citation, reproducibility, interoperability, and reuse. Model authors can also request peer review of their computational models to receive a DOI.
All users of models published in the library must cite model authors when they use and benefit from their code.
Please check out our model publishing tutorial and contact us if you have any questions or concerns about publishing your model(s) in the Computational Model Library.
We also maintain a curated database of over 7500 publications of agent-based and individual based models with additional detailed metadata on availability of code and bibliometric information on the landscape of ABM/IBM publications that we welcome you to explore.
Displaying 10 of 25 results grid clear search
Peer reviewed Torsten Hägerstrand’s Spatial Innovation Diffusion Model
Sean Bergin | Published Friday, September 14, 2012 | Last modified Saturday, April 27, 2013This model is a replication of Torsten Hägerstrand’s 1965 model–one of the earliest known calibrated and validated simulations with implicit “agent based” methodology.
Peer reviewed Co-adoption of low-carbon household energy technologies
Mart van der Kam Maria Lagomarsino Elie Azar Ulf Hahnel David Parra | Published Tuesday, August 29, 2023 | Last modified Friday, February 23, 2024The model simulates the diffusion of four low-carbon energy technologies among households: photovoltaic (PV) solar panels, electric vehicles (EVs), heat pumps, and home batteries. We model household decision making as the decision marking of one person, the agent. The agent decides whether to adopt these technologies. Hereby, the model can be used to study co-adoption behaviour, thereby going beyond traditional diffusion models that focus on the adop-tion of single technologies. The combination of these technologies is of particular interest be-cause (1) using the energy generated by PV solar panels for EVs and heat pumps can reduce emissions associated with transport and heating, respectively, and (2) EVs, heat pumps, and home batteries can help to integrate PV solar panels in local electricity grids by offering flexible demand (EVs and heat pumps) and energy storage (home batteries and EVs), thereby reducing grid impacts and associated upgrading costs.
The purpose of the model is to represent realistic adoption and co-adoption behaviour. This is achieved by grounding the decision model on the risks-as-feelings model (Loewenstein et al., 2001), theory from environmental and social psychology, and empirically informing agent be-haviour by survey-data among 1469 people in the Swiss region Romandie.
The model can be used to construct scenarios for the diffusion of the four low-carbon energy technologies depending on different contexts, and as a virtual experimentation environment for ex ante evaluation of policy interventions to stimulate adoption and co-adoption.
Peer reviewed Axelrod_Cultural_Dissemination
Arezky Hernández | Published Wednesday, March 27, 2013 | Last modified Sunday, May 05, 2013The Axelrod’s model of cultural dissemination is an agent-model designed to investigate the dissemination of culture among interacting agents on a society.
This paper presents an agent-based model to study the dynamics of city-state systems in a constrained environment with limited space and resources. The model comprises three types of agents: city-states, villages, and battalions, where city-states, the primary decision-makers, can build villages for food production and recruit battalions for defense and aggression. In this setting, simulation results, generated through a multi-parameter grid sampling, suggest that risk-seeking strategies are more effective in high-cost scenarios, provided that the production rate is sufficiently high. Also, the model highlights the role of output productivity in defining which strategic preferences are successful in a long-term scenario, with higher outputs supporting more aggressive expansion and military actions, while resource limitations compel more conservative strategies focused on survival and resource conservation. Finally, the results suggest the existence of a non-linear effect of diminishing returns in strategic investments on successful strategies, emphasizing the need for careful resource allocation in a competitive environment.
Critical Sustainability Transitions: Relaunching local agriculture after decline (Model code and description)
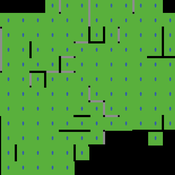
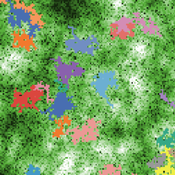
Pedro Lopez-Merino | Published Tuesday, April 30, 2024This model simulates the dynamics of agricultural land use change, specifically the transition between agricultural and non-agricultural land use in a spatial context. It explores the influence of various factors such as agricultural profitability, path dependency, and neighborhood effects on land use decisions.
The model operates on a grid of patches representing land parcels. Each patch can be in one of two states: exploited (green, representing agricultural land) or unexploited (brown, representing non-agricultural land). Agents (patches) transition between these states based on probabilistic rules. The main factors affecting these transitions are agricultural profitability, path dependency, and neighborhood effects.
-Agricultural Profitability: This factor is determined by the prob-agri function, which calculates the probability of a non-agricultural patch converting to agricultural based on income differences between agriculture and other sectors. -Path Dependency: Represented by the path-dependency parameter, it influences the likelihood of patches changing their state based on their current state. It’s a measure of inertia or resistance to change. -Neighborhood Effects: The neighborhood function calculates the number of exploited (agricultural) neighbors of a patch. This influences the decision of a patch to convert to agricultural land, representing the influence of surrounding land use on the decision-making process.
Animal territory formation (Reusable Building Block RBB)
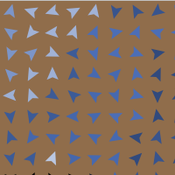
Robert Zakrzewski Stephanie Kramer-Schadt Volker Grimm | Published Sunday, November 12, 2023This is a generic sub-model of animal territory formation. It is meant to be a reusable building block, but not in the plug-and-play sense, as amendments are likely to be needed depending on the species and region. The sub-model comprises a grid of cells, reprenting the landscape. Each cell has a “quality” value, which quantifies the amount of resources provided for a territory owner, for example a tiger. “Quality” could be prey density, shelter, or just space. Animals are located randomly in the landscape and add grid cells to their intial cell until the sum of the quality of all their cells meets their needs. If a potential new cell to be added is owned by another animal, competition takes place. The quality values are static, and the model does not include demography, i.e. mortality, mating, reproduction. Also, movement within a territory is not represented.
Vaccine adoption with outgroup aversion using Cleveland area data
bruce1809 | Published Monday, July 31, 2023 | Last modified Sunday, August 06, 2023This model takes concepts from a JASSS paper this is accepted for the October, 2023 edition and applies the concepts to empirical data from counties surrounding and including Cleveland Ohio. The agent-based model has a proportional number of agents in each of the counties to represent the correct proportions of adults in these counties. The adoption decision probability uses the equations from Bass (1969) as adapted by Rand & Rust (2011). It also includes the Outgroup aversion factor from Smaldino, who initially had used a different imitation model on line grid. This model uses preferential attachment network as a metaphor for social networks influencing adoption. The preferential network can be adjusted in the model to be created based on both nodes preferred due to higher rank as well as a mild preference for nodes of a like group.
An empirical ABM for regional land use/cover change: a Dutch case study
Diego Valbuena | Published Saturday, March 12, 2011 | Last modified Thursday, November 11, 2021This is an empirical model described in http://dx.doi.org/10.1016/j.landurbplan.2010.05.001. The objective of the model is to simulate how the decision-making of farmers/agents with different strategies can affect the landscape structure in a region in the Netherlands.
Model of communication between two groups of managers in the course of project implementation
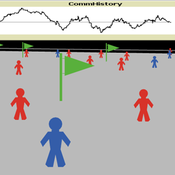
Smarzhevskiy Ivan | Published Monday, December 07, 2020This is a simulation model of communication between two groups of managers in the course of project implementation. The “world” of the model is a space of interaction between project participants, each of which belongs either to a group of work performers or to a group of customers. Information about the progress of the project is publicly available and represents the deviation Earned value (EV) from the planned project value (cost baseline).
The key elements of the model are 1) persons belonging to a group of customers or performers, 2) agents that are communication acts. The life cycle of persons is equal to the time of the simulation experiment, the life cycle of the communication act is 3 periods of model time (for the convenience of visualizing behavior during the experiment). The communication act occurs at a specific point in the model space, the coordinates of which are realized as random variables. During the experiment, persons randomly move in the model space. The communication act involves persons belonging to a group of customers and a group of performers, remote from the place of the communication act at a distance not exceeding the value of the communication radius (MaxCommRadius), while at least one representative from each of the groups must participate in the communication act. If none are found, the communication act is not carried out. The number of potential communication acts per unit of model time is a parameter of the model (CommPerTick).
The managerial sense of the feedback is the stimulating effect of the positive value of the accumulated communication complexity (positive background of the project implementation) on the productivity of the performers. Provided there is favorable communication (“trust”, “mutual understanding”) between the customer and the contractor, it is more likely that project operations will be performed with less lag behind the plan or ahead of it.
The behavior of agents in the world of the model (change of coordinates, visualization of agents’ belonging to a specific communicative act at a given time, etc.) is not informative. Content data are obtained in the form of time series of accumulated communicative complexity, the deviation of the earned value from the planned value, average indicators characterizing communication - the total number of communicative acts and the average number of their participants, etc. These data are displayed on graphs during the simulation experiment.
The control elements of the model allow seven independent values to be varied, which, even with a minimum number of varied values (three: minimum, maximum, optimum), gives 3^7 = 2187 different variants of initial conditions. In this case, the statistical processing of the results requires repeated calculation of the model indicators for each grid node. Thus, the set of varied parameters and the range of their variation is determined by the logic of a particular study and represents a significant narrowing of the full set of initial conditions for which the model allows simulation experiments.
…
Change and Senescence
André Martins | Published Tuesday, November 10, 2020Agers and non-agers agent compete over a spatial landscape. When two agents occupy the same grid, who will survive is decided by a random draw where chances of survival are proportional to fitness. Agents have offspring each time step who are born at a distance b from the parent agent and the offpring inherits their genetic fitness plus a random term. Genetic fitness decreases with time, representing environmental change but effective non-inheritable fitness can increase as animals learn and get bigger.
Displaying 10 of 25 results grid clear search