Our mission is to help computational modelers develop, document, and share their computational models in accordance with community standards and good open science and software engineering practices. Model authors can publish their model source code in the Computational Model Library with narrative documentation as well as metadata that supports open science and emerging norms that facilitate software citation, computational reproducibility / frictionless reuse, and interoperability. Model authors can also request private peer review of their computational models. Models that pass peer review receive a DOI once published.
All users of models published in the library must cite model authors when they use and benefit from their code.
Please check out our model publishing tutorial and feel free to contact us if you have any questions or concerns about publishing your model(s) in the Computational Model Library.
Displaying 10 of 966 results for "Wilfried van Sark" clear search
Design principles for a redistributive collective action institution in times of crisis
Aashis Joshi | Published Friday, September 15, 2023What policy measures are effective in redistributing essential resources during crisis situations such as climate change impacts? We model a collective action institution with different rules for designing and organizing it, and make our analysis specific to various societal contexts.
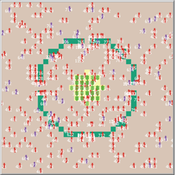
Our model captures a generic societal context of unequal vulnerability and climate change impact in a stylized form. We represent a community of people who harvest and consume an essential resource to maintain their well-being. However, their ability to harvest the resource is not equal; people are characterized by a ‘resource access’ attribute whose values are uniformly distributed from 0 to 1 in the population. A person’s resource access value determines the amount of resource units they are able to harvest, and therefore the welfare levels they are able to attain. People travel to the centralized resource region and derive well-being or welfare, represented as an energy gain, by harvesting and consuming resource units.
The community is subject to a climate change impact event that occurs with a certain periodicity and over a certain duration. The capacity of resource units to regenerate diminishes during the impact events. Unequal capacities to access the essential resource results in unequal vulnerability among people with regards to their ability to maintain a sufficient welfare level, especially during impact events.
…
Peer reviewed Evolutionary Economic Learning Simulation: A Genetic Algorithm for Dynamic 2x2 Strategic-Form Games in Python
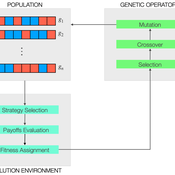
Vinicius Ferraz Thomas Pitz | Published Friday, April 08, 2022This project combines game theory and genetic algorithms in a simulation model for evolutionary learning and strategic behavior. It is often observed in the real world that strategic scenarios change over time, and deciding agents need to adapt to new information and environmental structures. Yet, game theory models often focus on static games, even for dynamic and temporal analyses. This simulation model introduces a heuristic procedure that enables these changes in strategic scenarios with Genetic Algorithms. Using normalized 2x2 strategic-form games as input, computational agents can interact and make decisions using three pre-defined decision rules: Nash Equilibrium, Hurwicz Rule, and Random. The games then are allowed to change over time as a function of the agent’s behavior through crossover and mutation. As a result, strategic behavior can be modeled in several simulated scenarios, and their impacts and outcomes can be analyzed, potentially transforming conflictual situations into harmony.
Customers going to a restaurant
hdouss | Published Tuesday, September 25, 2018The model is about customers going to a restaurant when they are hungry. They wait in the queue if no tables are available. Customers can leave the restaurant and got upset and decide to never return to the restaurant. The model tries to show 2 things: 1.the main caracteristics of the people that decided to never return to the restaurant and 2.the main factors that can impact the total number of customers that decided to never return to the restaurant.
Netlogo model ` Effect of Network Homophily and Partisanship on Social Media to “Oil Spill” Polarizations’
takuya nagura | Published Saturday, September 13, 2025This model was utilized for the simulation in the paper titled Effect of Network Homophily and Partisanship on Social Media to “Oil Spill” Polarizations. It allows you to examine whether oil spill polarization occurs through people’s communication under various conditions.
・Choose the network construction conditions you’d like to examine from the “rewire-style” chooser box.
・Select the desired strength of partisanship from the “partisanlevel” chooser box. You can also set the strength manually in the code tab.
・You can set the number of dynamic topics using the “number-of-topics” slider.
・Use the “divers-of-opinion” slider to set the number of preference types for each dynamic topic.
…
Friendship Games Rev 1.0
David Dixon | Published Friday, October 07, 2011 | Last modified Saturday, April 27, 2013A friendship game is a kind of network game: a game theory model on a network. This is a NetLogo model of an agent-based adaptation of “‘Friendship-based’ Games” by PJ Lamberson. The agents reach an equilibrium that depends on the strategy played and the topology of the network.
Simulating Sustainability of Collective Awareness Platform for Sustainability and Social Innovation (CAPS)
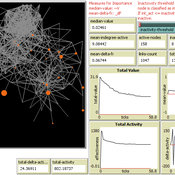
Peter Gerbrands | Published Friday, May 08, 2020In an associated paper which focuses on analyzing the structure of several egocentric networks of collective awareness platforms for sustainable innovation (CAPS), this model is developed. It answers the question whether the network structure is determinative for the sustainability of the created awareness. Based on a thorough literature review a model is developed to explain and operationalize the concept of sustainability of a social network in terms of importance, effectiveness and robustness. By developing this agent-based model, the expected outcomes after the dissolution of the CAPS are predicted and compared with the results of a network with the same participants but with different ties. Twitter data from different CAPS is collected and used to feed the simulation. The results show that the structure of the network is of key importance for its sustainability. With this knowledge and the ability to simulate the results after network changes have taken place, CAPS can assess the sustainability of their legacy and actively steer towards a longer lasting potential for social innovation. The retrieved knowledge urges organizations like the European Commission to adopt a more blended approach focusing not only on solving societal issues but on building a community to sustain the initiated development.
Leviathan group model and its approximation
Thibaut Roubin Guillaume Deffuant | Published Tuesday, July 26, 2022The model is based on the influence function of the Leviathan model (Deffuant, Carletti, Huet 2013 and Huet and Deffuant 2017) with the addition of group idenetity. We aim at better explaining some patterns generated by this model, using a derived mathematical approximation of the evolution of the opinions averaged.
We consider agents having an opinion/esteem about each other and about themselves. During dyadic meetings, agents change their respective opinion about each other, and possibly about other agents they gossip about, with a noisy perception of the opinions of their interlocutor. Highly valued agents are more influential in such encounters. Moreover, each agent belongs to a single group and the opinions within the group are attracted to their average.
We show that a group hierarchy can emerges from this model, and that the inequality of reputations among groups have a negative effect on the opinions about the groups of low status. The mathematical analysis of the opinion dynamic shows that the lower the status of the group, the more detrimental the interactions with the agents of other groups are for the opinions about this group, especially when gossip is activated. However, the interactions between agents of the same group tend to have a positive effect on the opinions about this group.

Peer reviewed The Indus Village's Weather model: procedural generation of daily weather
Andreas Angourakis | Published Tuesday, May 13, 2025Overview
The Weather model is a procedural generation model designed to create realistic daily weather data for socioecological simulations. It generates synthetic weather time series for solar radiation, temperature, and precipitation using algorithms based on sinusoidal and double logistic functions. The model incorporates stochastic variation to mimic unpredictable weather patterns and aims to provide realistic yet flexible weather inputs for exploring diverse climate scenarios.
The Weather model can be used independently or integrated into larger models, providing realistic weather patterns without extensive coding or data collection. It can be customized to meet specific requirements, enabling users to gain a better understanding of the underlying mechanisms and have greater confidence in their applications.
…

Biodynamica
Klaus Jaffe | Published Saturday, December 24, 2016Agent based simulation model for the study of the genetic evolution of sexual recombination and social behavior
PoliSEA: model of Policy – Social Ecological system Adaptation
Maja Schlüter Kirill Orach | Published Thursday, March 26, 2020PoliSEA represents a continuous policy process cycle, integrated with the dynamics of a fishery social-ecological system. The policy process in the model is represented by interactions between policymakers and interest groups and subsequent voting during which policymaker decide to increase or decrease the fishing quota for the next season. Policymakers’ positions can be influenced by lobbying of interest groups or interest group coalitions. The quota adopted through the policy process determines the amount of fish that can be harvested from the fish population during the season.
Displaying 10 of 966 results for "Wilfried van Sark" clear search