About the CoMSES Model Library more info
Our mission is to help computational modelers at all levels engage in the establishment and adoption of community standards and good practices for developing and sharing computational models. Model authors can freely publish their model source code in the Computational Model Library alongside narrative documentation, open science metadata, and other emerging open science norms that facilitate software citation, reproducibility, interoperability, and reuse. Model authors can also request peer review of their computational models to receive a DOI.
All users of models published in the library must cite model authors when they use and benefit from their code.
Please check out our model publishing tutorial and contact us if you have any questions or concerns about publishing your model(s) in the Computational Model Library.
We also maintain a curated database of over 7500 publications of agent-based and individual based models with additional detailed metadata on availability of code and bibliometric information on the landscape of ABM/IBM publications that we welcome you to explore.
Displaying 10 of 917 results for "Bert Van Meeuwen" clear search
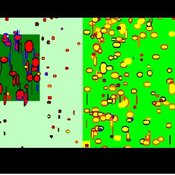
Sociodynamica in a Browser
Klaus Jaffe | Published Saturday, December 24, 2016Sociodynamica simulates the emergence of cooperation and of economic interactions, showing the synergy achieved by division of labor, the working of shame, and a number of other features that mold the evolution of social cooperation.
Bid-rigging Norms Game Model
HIDEYUKI MOROFUJI | Published Tuesday, July 27, 2021 | Last modified Friday, May 12, 2023In this simulation, we modify the norms game model to bid-rigging (collusion) model, while we can simulate also the norms game model.
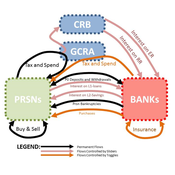
05 CmLab V1.17 – Conservation of Money Laboratory
Garvin Boyle | Published Saturday, April 15, 2017In CmLab we explore the implications of the phenomenon of Conservation of Money in a modern economy. This is one of a series of models exploring the dynamics of sustainable economics – PSoup, ModEco, EiLab, OamLab, MppLab, TpLab, CmLab.

Peer reviewed soslivestock model
Marco Janssen Irene Perez Ibarra Diego J. Soler-Navarro Alicia Tenza Peral | Published Wednesday, May 28, 2025 | Last modified Tuesday, June 10, 2025The purpose of this model is to analyze how different management strategies affect the wellbeing, sustainability and resilience of an extensive livestock system under scenarios of climate change and landscape configurations. For this purpose, it simulates one cattle farming system, in which agents (cattle) move through the space using resources (grass). Three farmer profiles are considered: 1) a subsistence farmer that emphasizes self-sufficiency and low costs with limited attention to herd management practices, 2) a commercial farmer focused on profit maximization through efficient production methods, and 3) an environmental farmer that prioritizes conservation of natural resources and animal welfare over profit maximization. These three farmer profiles share the same management strategies to adapt to climate and resource conditions, but differ in their goals and decision-making criteria for when, how, and whether to implement those strategies. This model is based on the SequiaBasalto model (Dieguez Cameroni et al. 2012, 2014, Bommel et al. 2014 and Morales et al. 2015), replicated in NetLogo by Soler-Navarro et al. (2023).
One year is 368 days. Seasons change every 92 days. Each step begins with the growth of grass as a function of climate and season. This is followed by updating the live weight of animals according to the grass height of their patch, and grass consumption, which is determined based on the updated live weight. Animals can be supplemented by the farmer in case of severe drought. After consumption, cows grow and reproduce, and a new grass height is calculated. This updated grass height value becomes the starting grass height for the next day. Cows then move to the next area with the highest grass height. After that, cattle prices are updated and cattle sales are held on the first day of fall. In the event of a severe drought, special sales are held. Finally, at the end of the day, the farm balance and the farmer’s effort are calculated.
Peer reviewed Horse population dynamics
Nika Galic | Published Tuesday, November 12, 2013 | Last modified Wednesday, October 29, 2014This model investigates the link between prescribed growth in body size, population dynamics and density dependence through population feedback on available resources.
Demographic microsimulation for individuals and couples
Sabine Zinn | Published Wednesday, January 14, 2015The simulation model conducts fine-grained population projection by specifying life course dynamics of individuals and couples by means of traditional demographic microsimulation and by using agent-based modeling for mate matching.
Peer reviewed Industrial Symbiosis Network implementation ABM
Igor Nikolic Kasper Pieter Hendrik Lange Gijsbert Korevaar Paulien Herder | Published Tuesday, December 01, 2020 | Last modified Wednesday, June 16, 2021The purpose of the model is to explore the influence of actor behaviour, combined with environment and business model design, on the survival rates of Industrial Symbiosis Networks (ISN), and the cash flows of the agents. We define an ISN to be robust, when it is able to run for 10 years, without falling apart due to leaving agents.
The model simulates the implementation of local waste exchange collaborations for compost production, through the ISN implementation stages of awareness, planning, negotiation, implementation, and evaluation.
One central firm plays the role of waste processor in a local composting initiative. This firm negotiates with other firms to become a supplier of their organic residual streams. The waste suppliers in the model can decide to join the initiative, or to have the waste brought to the external waste incinerator. The focal point of the model are the company-level interactions during the implementation or ending of synergies.
…
Agent-Based Simulation for International Tax Compliance
Peter Gerbrands | Published Tuesday, July 18, 2023Country-by-Country Reporting and Automatic Exchange of Information have recently been implemented in European Union (EU) countries. These international tax reforms increase tax compliance in the short term. In the long run, however, taxpayers will continue looking abroad to avoid taxation and, countries, looking for additional revenues, will provide opportunities. As a result, tax competition intensifies and the initial increase in compliance could reverse. To avoid international tax reforms being counteracted by tax competition, this paper suggests bilateral responsive regulation to maximize compliance. This implies that countries would use different tax policy instruments toward other countries, including tax and secrecy havens.
To assess the effectiveness of fully or partially enforce tax policies, this agent based model has been ran many times under different enforcement rules, which influence the perceived enforced- and voluntary compliance, as the slippery-slope model prescribes. Based on the dynamics of this perception and the extent to which agents influence each other, the annual amounts of tax evasion, tax avoidance and taxes paid are calculated over longer periods of time.
The agent-based simulation finds that a differentiated policy response could increase tax compliance by 6.54 percent, which translates into an annual increase of €105 billion in EU tax revenues on income, profits, and capital gains. Corporate income tax revenues in France, Spain, and the UK alone would already account for €35 billion.
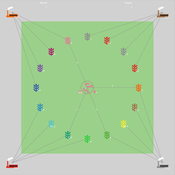
Prisoner's Dilemma Game on Complex Networks with Agents' Adaptive Expectations
Bo Xianyu | Published Wednesday, November 16, 2011 | Last modified Saturday, April 27, 2013This model studies the effect of the agents’ adaptive expectation on cooperation frequency in the prisoner’s dilemma game in complex networks from an agent based approach. The model is implemented in Repast simphony 1.2.
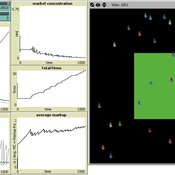
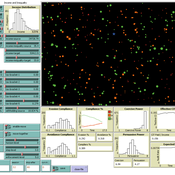
Toward Market Structure as a Complex System: A Web Based Simulation Assignment Implemented in Netlogo
Timothy Kochanski | Published Monday, February 14, 2011 | Last modified Saturday, April 27, 2013This is the model for a paper that is based on a simulation model, programmed in Netlogo, that demonstrates changes in market structure that occur as marginal costs, demand, and barriers to entry change. Students predict and observe market structure changes in terms of number of firms, market concentration, market price and quantity, and average marginal costs, profits, and markups across the market as firms innovate. By adjusting the demand growth and barriers to entry, students can […]
Displaying 10 of 917 results for "Bert Van Meeuwen" clear search