About the CoMSES Model Library more info
Our mission is to help computational modelers at all levels engage in the establishment and adoption of community standards and good practices for developing and sharing computational models. Model authors can freely publish their model source code in the Computational Model Library alongside narrative documentation, open science metadata, and other emerging open science norms that facilitate software citation, reproducibility, interoperability, and reuse. Model authors can also request peer review of their computational models to receive a DOI.
All users of models published in the library must cite model authors when they use and benefit from their code.
Please check out our model publishing tutorial and contact us if you have any questions or concerns about publishing your model(s) in the Computational Model Library.
We also maintain a curated database of over 7500 publications of agent-based and individual based models with additional detailed metadata on availability of code and bibliometric information on the landscape of ABM/IBM publications that we welcome you to explore.
Displaying 10 of 256 results for "Eckhard Auch" clear search
An Agent-Based Model of Space Settlements
Anamaria Berea | Published Wednesday, August 09, 2023 | Last modified Wednesday, November 01, 2023Background: Establishing a human settlement on Mars is an incredibly complex engineering problem. The inhospitable nature of the Martian environment requires any habitat to be largely self-sustaining. Beyond mining a few basic minerals and water, the colonizers will be dependent on Earth resupply and replenishment of necessities via technological means, i.e., splitting Martian water into oxygen for breathing and hydrogen for fuel. Beyond the technical and engineering challenges, future colonists will also face psychological and human behavior challenges.
Objective: Our goal is to better understand the behavioral and psychological interactions of future Martian colonists through an Agent-Based Modeling (ABM simulation) approach. We seek to identify areas of consideration for planning a colony as well as propose a minimum initial population size required to create a stable colony.
Methods: Accounting for engineering and technological limitations, we draw on research regarding high performing teams in isolated and high stress environments (ex: submarines, Arctic exploration, ISS, war) to include the 4 NASA personality types within the ABM. Interactions between agents with different psychological profiles are modeled at the individual level, while global events such as accidents or delays in Earth resupply affect the colony as a whole.
Results: From our multiple simulations and scenarios (up to 28 Earth years), we found that an initial population of 22 was the minimum required to maintain a viable colony size over the long run. We also found that the Agreeable personality type was the one more likely to survive.
Conclusion We developed a simulation with easy to use GUI to explore various scenarios of human interactions (social, labor, economic, psychological) on a future colony on Mars. We included technological and engineering challenges, but our focus is on the behavioral and psychological effects on the sustainability of the colony on the long run. We find, contrary to other literature, that the minimum number of people with all personality types that can lead to a sustainable settlement is in the tens and not hundreds.
Shellmound Mobility
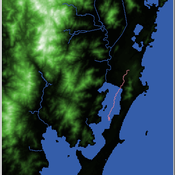
Henrique de Sena Kozlowski | Published Saturday, June 15, 2024Least Cost Path (LCP) analysis is a recurrent theme in spatial archaeology. Based on a cost of movement image, the user can interpret how difficult it is to travel around in a landscape. This kind of analysis frequently uses GIS tools to assess different landscapes. This model incorporates some aspects of the LCP analysis based on GIS with the capabilities of agent-based modeling, such as the possibility to simulate random behavior when moving. In this model the agent will travel around the coastal landscape of Southern Brazil, assessing its path based on the different cost of travel through the patches. The agents represent shellmound builders (sambaquieiros), who will travel mainly through the use of canoes around the lagoons.
How it works?
When the simulation starts the hiker agent moves around the world, a representation of the lagoon landscape of the Santa Catarina state in Southern Brazil. The agent movement is based on the travel cost of each patch. This travel cost is taken from a cost surface raster created in ArcMap to represent the different cost of movement around the landscape. Each tick the agent will have a chance to select the best possible patch to move in its Field of View (FOV) that will take it towards its target destination. If it doesn’t select the best possible patch, it will randomly choose one of the patches to move in its FOV. The simulation stops when the hiker agent reaches the target destination. The elevation raster file and the cost surface map are based on a 1 Arc-second (30m) resolution SRTM image, scaled down 5 times. Each patch represents a square of 150m, with an area of 0,0225km². The dataset uses a UTM Sirgas 2000 22S projection system. There are four different cost functions available to use. They change the cost surface used by the hikers to navigate around the world.
An agent-based model of school enrollment process under educational competition
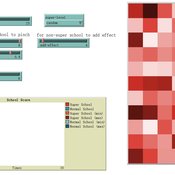
Yao Tong | Published Sunday, August 04, 2024Due to the role of education in promoting social status and facilitating upward social mobility, individuals and their families spare no effort to pursue better educational opportunities, especially in countries where education is highly competitive.
In China, the enrollment of senior high schools and universities mainly follows a ranking system based on students’ scores in national entrance exams (Zhongkao and Gaokao). Typically, students with higher scores have priority in choosing schools and endeavor to get into better senior high schools to increase their chances of entering a prestigious university.
However, students can only select “better” senior high schools based on their average Gaokao grades, which are strongly influenced by the initial performance (Zhongkao grades) of enrolled students. The true quality indicator of school education (schooling effect, defined as the grade improvement achieved through education at the senior high school) is unknowable. This raises the first question: will school rankings reflect the real educational quality of schools over decades of educational competition, or merely the initial quality of the students they enroll?
…
Peer reviewed Behavioral Dynamics of Epidemic Trajectories and Vaccination Strategies: An Agent-Based Model
Ziyuan Zhang | Published Tuesday, December 10, 2024This agent-based model explores the dynamics between human behavior and vaccination strategies during COVID-19 pandemics. It examines how individual risk perceptions influence behaviors and subsequently affect epidemic outcomes in a simulated metropolitan area resembling New York City from December 2020 to May 2021.
Agents modify their daily activities—deciding whether to travel to densely populated urban centers or stay in less crowded neighborhoods—based on their risk perception. This perception is influenced by factors such as risk perception threshold, risk tolerance personality, mortality rate, disease prevalence, and the average number of contacts per agent in crowded settings. Agent characteristics are carefully calibrated to reflect New York City demographics, including age distribution and variations in infection probability and mortality rates across these groups. The agents can experience six distinct health statuses: susceptible, exposed, infectious, recovered from infection, dead, and vaccinated (SEIRDV). The simulation focuses on the Iota and Alpha variants, the dominant strains in New York City during the period.
We simulate six scenarios divided into three main categories:
1. A baseline model without vaccinations where agents exhibit no risk perception and are indifferent to virus transmission and disease prevalence.
…
An Agent-Based Model of Insurance Customer Behaviour with Word of Mouth Network in C#
Rei England Iqbal Owadally Douglas Wright | Published Friday, March 04, 2022This is an agent-based model with two types of agents: customers and insurers. Insurers are price-takers who choose how much to spend on their service quality, and customers evaluate insurers based on premium, brand preference, and their perceived service quality. Customers are also connected in a small-world network and may share their opinions with their network.
The ABM contains two types of agents: insurers and customers. These act within the environment of a motor insurance market. At each simulation, the model undergoes the following steps:
- Network generation: At the start of the simulation, the model generates a small world network of social links between the customers, and randomly assigns each customer to an initial insurer ...
Space colonization
allagonne | Published Wednesday, January 05, 2022Agent-Based-Modeling - space colonization
ask me for the .nlogo model
WHAT IS IT?
The goal of this project is to simulate with NetLogo (v6.2) a space colonization of humans, starting from Earth, into the Milky Way.
HOW IT WORKS
…
The Evolution of Multiple Resistant Strains: An Abstract Model of Systemic Treatment and Accumulated Resistance
Benjamin Nye | Published Wednesday, August 31, 2011 | Last modified Saturday, April 27, 2013This model is intended to explore the effectiveness of different courses of interventions on an abstract population of infections. Illustrative findings highlight the importance of the mechanisms for variability and mutation on the effectiveness of different interventions.
Rebel Group Protection Rackets
Frances Duffy Kamil C. Klosek Luis Gustavo Nardin Gerd Wagner | Published Wednesday, December 04, 2019System Narrative
How do rebel groups control territory and engage with the local economy during civil war? Charles Tilly’s seminal War and State Making as Organized Crime (1985) posits that the process of waging war and providing governance resembles that of a protection racket, in which aspiring governing groups will extort local populations in order to gain power, and civilians or businesses will pay in order to ensure their own protection. As civil war research increasingly probes the mechanisms that fuel local disputes and the origination of violence, we develop an agent-based simulation model to explore the economic relationship of rebel groups with local populations, using extortion racket interactions to explain the dynamics of rebel fighting, their impact on the economy, and the importance of their economic base of support. This analysis provides insights for understanding the causes and byproducts of rebel competition in present-day conflicts, such as the cases of South Sudan, Afghanistan, and Somalia.
Model Description
The model defines two object types: RebelGroup and Enterprise. A RebelGroup is a group that competes for power in a system of anarchy, in which there is effectively no government control. An Enterprise is a local civilian-level actor that conducts business in this environment, whose objective is to make a profit. In this system, a RebelGroup may choose to extort money from Enterprises in order to support its fighting efforts. It can extract payments from an Enterprise, which fears for its safety if it does not pay. This adds some amount of money to the RebelGroup’s resources, and they can return to extort the same Enterprise again. The RebelGroup can also choose to loot the Enterprise instead. This results in gaining all of the Enterprise wealth, but prompts the individual Enterprise to flee, or leave the model. This reduces the available pool of Enterprises available to the RebelGroup for extortion. Following these interactions the RebelGroup can choose to AllocateWealth, or pay its rebel fighters. Depending on the value of its available resources, it can add more rebels or expel some of those which it already has, changing its size. It can also choose to expand over new territory, or effectively increase its number of potential extorting Enterprises. As a response to these dynamics, an Enterprise can choose to Report expansion to another RebelGroup, which results in fighting between the two groups. This system shows how, faced with economic choices, RebelGroups and Enterprises make decisions in war that impact conflict and violence outcomes.
Universal Darwinism in Dutch Greenhouses
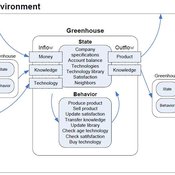
Julia Kasmire | Published Wednesday, May 09, 2012 | Last modified Saturday, April 27, 2013An ABM, derived from a case study and a series of surveys with greenhouse growers in the Westland, Netherlands. Experiments using this model showshow that the greenhouse horticulture industry displays diversity, adaptive complexity and an uneven distribution, which all suggest that the industry is an evolving system.
Peer reviewed Personnel decisions in the hierarchy
Smarzhevskiy Ivan | Published Friday, August 19, 2022This is a model of organizational behavior in the hierarchy in which personnel decisions are made.
The idea of the model is that the hierarchy, busy with operations, is described by such characteristics as structure (number and interrelation of positions) and material, filling these positions (persons with their individual performance). A particular hierarchy is under certain external pressure (performance level requirement) and is characterized by the internal state of the material (the distribution of the perceptions of others over the ensemble of persons).
The World of the model is a four-level hierarchical structure, consisting of shuff positions of the top manager (zero level of the hierarchy), first-level managers who are subordinate to the top manager, second-level managers (subordinate to the first-level managers) and positions of employees (the third level of the hierarchy). ) subordinated to the second-level managers. Such a hierarchy is a tree, i.e. each position, with the exception of the position of top manager, has a single boss.
Agents in the model are persons occupying the specified positions, the number of persons is set by the slider (HumansQty). Personas have some operational performance (harisma, an unfortunate attribute name left over from the first edition of the model)) and a sense of other personas’ own perceptions. Performance values are distributed over the ensemble of persons according to the normal law with some mean value and variance.
The value of perception by agents of each other is positive or negative (implemented in the model as numerical values equal to +1 and -1). The distribution of perceptions over an ensemble of persons is implemented as a random variable specified by the probability of negative perception, the value of which is set by the control elements of the model interface. The numerical value of the probability equal to 0 corresponds to the case in which all persons positively perceive each other (the numerical value of the random variable is equal to 1, which corresponds to the positive perception of the other person by the individual).
The hierarchy is occupied with operational activity, the degree of intensity of which is set by the external parameter Difficulty. The level of productivity of each manager OAIndex is equal to the level of productivity of the department he leads and is the ratio of the sum of productivity of employees subordinate to the head to the level of complexity of the work Difficulty. An increase in the numerical value of Difficulty leads to a decrease in the OAIndex for all subdivisions of the hierarchy. The managerial meaning of the OAIndex indicator is the percentage of completion of the load specified for the hierarchy as a whole, i.e. the ratio of the actual performance of the structural subdivisions of the hierarchy to the required performance, the level of which is specified by the value of the Difficulty parameter.
…
Displaying 10 of 256 results for "Eckhard Auch" clear search


