About the CoMSES Model Library more info
Our mission is to help computational modelers at all levels engage in the establishment and adoption of community standards and good practices for developing and sharing computational models. Model authors can freely publish their model source code in the Computational Model Library alongside narrative documentation, open science metadata, and other emerging open science norms that facilitate software citation, reproducibility, interoperability, and reuse. Model authors can also request peer review of their computational models to receive a DOI.
All users of models published in the library must cite model authors when they use and benefit from their code.
Please check out our model publishing tutorial and contact us if you have any questions or concerns about publishing your model(s) in the Computational Model Library.
We also maintain a curated database of over 7500 publications of agent-based and individual based models with additional detailed metadata on availability of code and bibliometric information on the landscape of ABM/IBM publications that we welcome you to explore.
Displaying 10 of 257 results for "Philipp S. Sommer" clear search
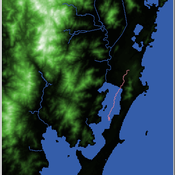
Shellmound Mobility
Henrique de Sena Kozlowski | Published Saturday, June 15, 2024Least Cost Path (LCP) analysis is a recurrent theme in spatial archaeology. Based on a cost of movement image, the user can interpret how difficult it is to travel around in a landscape. This kind of analysis frequently uses GIS tools to assess different landscapes. This model incorporates some aspects of the LCP analysis based on GIS with the capabilities of agent-based modeling, such as the possibility to simulate random behavior when moving. In this model the agent will travel around the coastal landscape of Southern Brazil, assessing its path based on the different cost of travel through the patches. The agents represent shellmound builders (sambaquieiros), who will travel mainly through the use of canoes around the lagoons.
How it works?
When the simulation starts the hiker agent moves around the world, a representation of the lagoon landscape of the Santa Catarina state in Southern Brazil. The agent movement is based on the travel cost of each patch. This travel cost is taken from a cost surface raster created in ArcMap to represent the different cost of movement around the landscape. Each tick the agent will have a chance to select the best possible patch to move in its Field of View (FOV) that will take it towards its target destination. If it doesn’t select the best possible patch, it will randomly choose one of the patches to move in its FOV. The simulation stops when the hiker agent reaches the target destination. The elevation raster file and the cost surface map are based on a 1 Arc-second (30m) resolution SRTM image, scaled down 5 times. Each patch represents a square of 150m, with an area of 0,0225km². The dataset uses a UTM Sirgas 2000 22S projection system. There are four different cost functions available to use. They change the cost surface used by the hikers to navigate around the world.
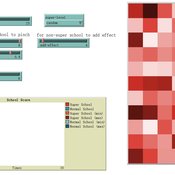
An agent-based model of school enrollment process under educational competition
Yao Tong | Published Sunday, August 04, 2024Due to the role of education in promoting social status and facilitating upward social mobility, individuals and their families spare no effort to pursue better educational opportunities, especially in countries where education is highly competitive.
In China, the enrollment of senior high schools and universities mainly follows a ranking system based on students’ scores in national entrance exams (Zhongkao and Gaokao). Typically, students with higher scores have priority in choosing schools and endeavor to get into better senior high schools to increase their chances of entering a prestigious university.
However, students can only select “better” senior high schools based on their average Gaokao grades, which are strongly influenced by the initial performance (Zhongkao grades) of enrolled students. The true quality indicator of school education (schooling effect, defined as the grade improvement achieved through education at the senior high school) is unknowable. This raises the first question: will school rankings reflect the real educational quality of schools over decades of educational competition, or merely the initial quality of the students they enroll?
…
A Simple Agent Based Modeling Tool for Plastic and Debris Tracking in Oceans
Subu Kandaswamy Koushik Sura Bhaskar Sai Amulya Murukutla Sai Pranay Raju Chinthala Abhishek Bobbillapati | Published Monday, October 04, 2021Plastics and the pollution caused by their waste have always been a menace to both nature and humans. With the continual increase in plastic waste, the contamination due to plastic has stretched to the oceans. Many plastics are being drained into the oceans and rose to accumulate in the oceans. These plastics have seemed to form large patches of debris that keep floating in the oceans over the years. Identification of the plastic debris in the ocean is challenging and it is essential to clean plastic debris from the ocean. We propose a simple tool built using the agent-based modeling framework NetLogo. The tool uses ocean currents data and plastic data both being loaded using GIS (Geographic Information System) to simulate and visualize the movement of floatable plastic and debris in the oceans. The tool can be used to identify the plastic debris that has been piled up in the oceans. The tool can also be used as a teaching aid in classrooms to bring awareness about the impact of plastic pollution. This tool could additionally assist people to realize how a small plastic chunk discarded can end up as large debris drifting in the oceans. The same tool might help us narrow down the search area while looking out for missing cargo and wreckage parts of ships or flights. Though the tool does not pinpoint the location, it might help in reducing the search area and might be a rudimentary alternative for more computationally expensive models.
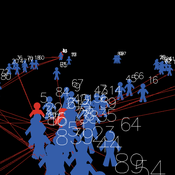
Peer reviewed Organizational behavior in the hierarchy model
Smarzhevskiy Ivan | Published Tuesday, June 18, 2019 | Last modified Wednesday, July 31, 2019In a two-level hierarchical structure (consisting of the positions of managers and operators), persons holding these positions have a certain performance and the value of their own (personal perception in this, simplified, version of the model) perception of each other. The value of the perception of each other by agents is defined as a random variable that has a normal distribution (distribution parameters are set by the control elements of the interface).
In the world of the model, which is the space of perceptions, agents implement two strategies: rapprochement with agents that perceive positively and distance from agents that perceive negatively (both can be implemented, one of these strategies, or neither, the other strategy, which makes the agent stationary). Strategies are implemented in relation to those agents that are in the radius of perception (PerRadius).
The manager (Head) forms a team of agents. The performance of the group (the sum of the individual productivities of subordinates, weighted by the distance from the leader) varies depending on the position of the agents in space and the values of their individual productivities. Individual productivities, in the current version of the model, are set as a random variable distributed evenly on a numerical segment from 0 to 100. The manager forms the team 1) from agents that are in (organizational) radius (Op_Radius), 2) among agents that the manager perceives positively and / or negatively (both can be implemented, one of the specified rules, or neither, which means the refusal of the command formation).
Agents can (with a certain probability, given by the variable PrbltyOfDecisn%), in case of a negative perception of the manager, leave his group permanently.
It is possible in the model to change on the fly radii values, update the perception value across the entire population and the perception of an individual agent by its neighbors within the perception radius, and the probability values for a subordinate to make a decision about leaving the group.
You can also change the set of strategies for moving agents and strategies for recruiting a team manager. It is possible to add a randomness factor to the movement of agents (Stoch_Motion_Speed, the default is set to 0, that is, there are no random movements).
…
In-group favoritism due to friend selection strategies based on fixed tag and within-group reputation
Yutaka Nakai | Published Friday, March 28, 2014 | Last modified Friday, March 28, 2014An agent-based model simulates emergence of in-group favoritism. Agents adopt friend selection strategies using an invariable tag and reputations meaning how cooperative others are to a group. The reputation can be seen as a kind of public opinion.
An Agent-Based Model of Insurance Customer Behaviour with Word of Mouth Network in C#
Rei England Iqbal Owadally Douglas Wright | Published Friday, March 04, 2022This is an agent-based model with two types of agents: customers and insurers. Insurers are price-takers who choose how much to spend on their service quality, and customers evaluate insurers based on premium, brand preference, and their perceived service quality. Customers are also connected in a small-world network and may share their opinions with their network.
The ABM contains two types of agents: insurers and customers. These act within the environment of a motor insurance market. At each simulation, the model undergoes the following steps:
- Network generation: At the start of the simulation, the model generates a small world network of social links between the customers, and randomly assigns each customer to an initial insurer ...
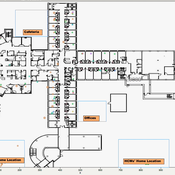
Knowledge Sharing in a Hospital
bpint Emily Molfino Joshua Goldstein Kathryn Schaefer Ziemer Mark Orr Bryan Lewis Jose Jimenez | Published Friday, January 27, 2023Organizations are complex systems comprised of many dynamic and evolving interaction patterns among individuals and groups. Understanding these interactions and how patterns, such as informal structures and knowledge sharing behavior, emerge are crucial to creating effective and efficient organizations. To explore such organizational dynamics, the agent-based model integrates a cognitive model, dynamic social networks, and a physical environment.
WeDiG Sim
Reza Shamsaee | Published Monday, May 14, 2012 | Last modified Saturday, April 27, 2013WeDiG Sim- Weighted Directed Graph Simulator - is an open source application that serves to simulate complex systems. WeDiG Sim reflects the behaviors of those complex systems that put stress on scale-free, weightedness, and directedness. It has been implemented based on “WeDiG model” that is newly presented in this domain. The WeDiG model can be seen as a generalized version of “Barabási-Albert (BA) model”. WeDiG not only deals with weighed directed systems, but also it can handle the […]
Peer reviewed AgModel
Isaac Ullah | Published Friday, December 06, 2024AgModel is an agent-based model of the forager-farmer transition. The model consists of a single software agent that, conceptually, can be thought of as a single hunter-gather community (i.e., a co-residential group that shares in subsistence activities and decision making). The agent has several characteristics, including a population of human foragers, intrinsic birth and death rates, an annual total energy need, and an available amount of foraging labor. The model assumes a central-place foraging strategy in a fixed territory for a two-resource economy: cereal grains and prey animals. The territory has a fixed number of patches, and a starting number of prey. While the model is not spatially explicit, it does assume some spatiality of resources by including search times.
Demographic and environmental components of the simulation occur and are updated at an annual temporal resolution, but foraging decisions are “event” based so that many such decisions will be made in each year. Thus, each new year, the foraging agent must undertake a series of optimal foraging decisions based on its current knowledge of the availability of cereals and prey animals. Other resources are not accounted for in the model directly, but can be assumed for by adjusting the total number of required annual energy intake that the foraging agent uses to calculate its cereal and prey animal foraging decisions. The agent proceeds to balance the net benefits of the chance of finding, processing, and consuming a prey animal, versus that of finding a cereal patch, and processing and consuming that cereal. These decisions continue until the annual kcal target is reached (balanced on the current human population). If the agent consumes all available resources in a given year, it may “starve”. Starvation will affect birth and death rates, as will foraging success, and so the population will increase or decrease according to a probabilistic function (perturbed by some stochasticity) and the agent’s foraging success or failure. The agent is also constrained by labor caps, set by the modeler at model initialization. If the agent expends its yearly budget of person-hours for hunting or foraging, then the agent can no longer do those activities that year, and it may starve.
Foragers choose to either expend their annual labor budget either hunting prey animals or harvesting cereal patches. If the agent chooses to harvest prey animals, they will expend energy searching for and processing prey animals. prey animals search times are density dependent, and the number of prey animals per encounter and handling times can be altered in the model parameterization (e.g. to increase the payoff per encounter). Prey animal populations are also subject to intrinsic birth and death rates with the addition of additional deaths caused by human predation. A small amount of prey animals may “migrate” into the territory each year. This prevents prey animals populations from complete decimation, but also may be used to model increased distances of logistic mobility (or, perhaps, even residential mobility within a larger territory).
…
Evaluate government policies for farmers’ adoption and synergy in improving irrigation systems
Amir Hajimirzajan | Published Sunday, February 25, 2024The ABM model is designed to model the adaptability of farmers in DTIM. This model includes two groups of farmers and local government admins agents. Farmers with different levels, with low WP of DTIM, are looking for economic benefits and reduced irrigation and production costs. Meanwhile, the government is looking for strategic goals to maintain water resources’ sustainability. The local government admins employ incentives (subsidies in this study) to encourage farmers to DTIM. In addition, it is used as a tool for supervision and training farmers’ performance. Farmers are currently harvesting water resources with irrigation systems and different levels of technology, and they intend to provide short-term benefits. Farmers adjust the existing approach based on their knowledge of the importance of DTIM and propensity to increase WP and cost-benefit evaluation. DTIM has an initial implementation fee. Every farmer can increase WP by using government subsidies. If none of the farmers create optimal use of water resources, access to water resources will be threatened in the long term. This is considered a hypothetical cost for farmers who do not participate in DTIM. With DTIM, considering that local government admins’ facilities cover an essential part of implementation costs, farmers may think of profiting from local government admins’ facilities by selling that equipment, especially if the farmers in the following conditions may consider selling their developed irrigation equipment. In this case, the technology of their irrigation system will return to the state before development.
- When the threshold of farmers’ propensity to DTIM is low (for example, in the conditions of scarcity of access to sufficient training about the new irrigation system or its role in reducing the cost and sustainability of water resources)
- When the share of government subsidy is high, and as a result, the profit from the sale of equipment is attractive, especially in conditions of inflation.
- Finally, farmers’ honesty threshold should be reduced based on the positive experience of profit-seeking and deception among neighbors.
Increasing the share of government subsidies can encourage farmers to earn profits. Therefore, the government can help increase farmers’ profits by considering the assessment teams at different levels with DTIM training . local government admins evaluations monitor the behavior of farmers. If farmers sell their improved irrigation system for profit, they may be deprived of some local government admins’ services and the possibility of receiving subsidies again. Assessments The local government admins can increase farmers’ honesty. Next, the ABM model evaluates local government admins policies to achieve a suitable framework for water resources management in the Miandoab region.
Displaying 10 of 257 results for "Philipp S. Sommer" clear search