About the CoMSES Model Library more info
Our mission is to help computational modelers develop, document, and share their computational models in accordance with community standards and good open science and software engineering practices. Model authors can publish their model source code in the Computational Model Library with narrative documentation as well as metadata that supports open science and emerging norms that facilitate software citation, computational reproducibility / frictionless reuse, and interoperability. Model authors can also request private peer review of their computational models. Models that pass peer review receive a DOI once published.
All users of models published in the library must cite model authors when they use and benefit from their code.
Please check out our model publishing tutorial and feel free to contact us if you have any questions or concerns about publishing your model(s) in the Computational Model Library.
We also maintain a curated database of over 7500 publications of agent-based and individual based models with detailed metadata on availability of code and bibliometric information on the landscape of ABM/IBM publications that we welcome you to explore.
Displaying 10 of 68 results energy clear search
Using a simple ABM to help undergraduates understand impacts of an invasive species: fish, lionfish, and zooplankton
Samantha Farquhar | Published Friday, February 24, 2023This model is an implementation of a predator-prey simulation using NetLogo programming language. It simulates the interaction between fish, lionfish, and zooplankton. Fish and lionfish are both represented as turtles, and they have their own energy level. In this simulation, lionfish eat fish, and fish eat zooplankton. Zooplankton are represented as green patches on the NetLogo world. Lionfish and fish can reproduce and gain energy by eating other turtles or zooplankton.
This model was created to help undergraduate students understand how simulation models might be helpful in addressing complex environmental problems. In this case, students were asked to use this model to make predictions about how the introduction of lionfish (considered an invasive species in some places) might alter the ecosystem.
Direct versus Connect
Steven Kimbrough | Published Sunday, January 15, 2023This NetLogo model is an implementation of the mostly verbal (and graphic) model in Jarret Walker’s Human Transit: How Clearer Thinking about Public Transit Can Enrich Our Communities and Our Lives (2011). Walker’s discussion is in the chapter “Connections or Complexity?”. See especially figure 12-2, which is on page 151.
In “Connections or Complexity?”, Walker frames the matter as involving a choice between two conflicting goals. The first goal is to minimize connections, the need to make transfers, in a transit system. People naturally prefer direct routes. The second goal is to minimize complexity. Why? Well, read the chapter, but as a general proposition we want to avoid unnecessary complexity with its attendant operating characteristics (confusing route plans in the case of transit) and management and maintenance challenges. With complexity general comes degraded robustness and resilience.
How do we, how can we, choose between these conflicting goals? The grand suggestion here is that we only choose indirectly, implicitly. In the present example of connections versus complexity we model various alternatives and compare them on measures of performance (MoP) other than complexity or connections per se. The suggestion is that connections and complexity are indicators of, heuristics for, other MoPs that are more fundamental, such as cost, robustness, energy use, etc., and it is these that we at bottom care most about. (Alternatively, and not inconsistently, we can view connections and complexity as two of many MoPs, with the larger issue to be resolve in light of many MoPs, including but not limited to complexity and connections.) We employ modeling to get a handle on these MoPs. Typically, there will be several, taking us thus to a multiple criteria decision making (MCDM) situation. That’s the big picture.
Household Energy Retrofit Behavior (HERB) ABM
Lars Even Egner | Published Thursday, October 20, 2022The HERB model simulates the retrofit behavior of homeowners in a neighborhood. The model initially parameterizes a neighborhood and households with technical factors such as energy standard, the availability of subsidies, and neighbors’ retrofit activity. Then, these factors are translated into psychological variables such as perceived comfort gain, worry about affording the retrofit, and perceiving the current energy standard of the home as wasteful. These psychological variables moderate the transition between four different stages of deciding to retrofit, as suggested by a behavioral model specific to household energy retrofitting identified based on a large population survey in Norway. The transition between all stages eventually leads to retrofitting, which affects both the household’s technical factors and friends and neighbors, bringing the model “full circle”. The model assumes that the energy standard of the buildings deteriorates over time, forcing households to retrofit regularly to maintain a certain energy standard.
Because experiment datafiles are about 15GB, they are available at https://doi.org/10.18710/XOSAMD
Peer reviewed The Viability of the Social-Ecological Agroecosystem (ViSA) Spatial Agent-based Model
Mostafa Shaaban | Published Friday, June 03, 2022ViSA simulates the decision behaviors of different stakeholders showing demands for ecosystem services (ESS) in agricultural landscape. The lack of sufficient supply of ESSs triggers stakeholders to apply different management options to increase their supply. However, while attempting to reduce the supply-demand gap, conflicts arise among stakeholders due to the tradeoff nature of some ESS. ViSA investigates conditions and scenarios that can minimize such supply-demand gap while reducing the risk of conflicts by suggesting different mixes of management options and decision rules.
ABM for Underwater optical wireless communication in a water tank
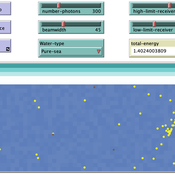
Mohamed ABID | Published Sunday, May 29, 2022This model simulates the propagation of photons in a water tank. A source of light emits an impulse of photons with equal energy represented by yellow dots. These photons are then scattered by water particles before possibly reaching the photo-detector represented by a gray line. Different types of water are considered. For each one of them we calculate the total received energy.
The water tank is represented by a blue rectangle with fixed dimensions. It’s exposed to the air interface and has totally absorbent barriers. Four types of water are supported. Each one is characterized by its absorption and scattering coefficients.
At the source, the photons are generated uniformly with a random direction within the beamwidth. Each photon travels a random distance drawn from a distribution depending on the water characteristics before encountering a water particle.
Based on the updated position of the photon, three situations may occur:
-The photon hits the barrier of the tank on its trajectory. In this case it’s considered as lost since the barriers are assumed totally absorbent.
…
The Friendship Field
Eva Timmer Chrisja van de Kieft | Published Thursday, May 26, 2022 | Last modified Tuesday, August 30, 2022The Friendship Field model aims at modelling friendship formation based on three factors: Extraversion, Resemblance and Status, where social interaction is motivated by the Social Battery. Social Battery is one’s energy and motivation to engage in social contact. Since social contact is crucial for friendship formation, the model included Social Battery to affect social interactions. To our best knowledge, Social Battery is a yet unintroduced concept in research while it is a dynamic factor influencing the social interaction besides one’s characteristics. Extraverts’ Social Batteries charge while interacting and exhaust while being alone. Introverts’ Social Batteries charge while being alone and exhaust while interacting. The aim of the model is to illustrate the concept of Social Battery. Moreover, the Friendship Field shows patterns regarding Extraversion, Resemblance and Status including the mere-exposure effect and friendship by similarity. For the implementation of Status, Kemper’s status-power theory is used. The concept of Social Battery is also linked to Kemper’s theory on the organism as reference group. By running the model for a year (3 interactions moments per day), the friendship dynamics over time can be studied.
We presented the model at the Social Simulation Conference 2022.
AMIRIS
Ulrich Frey Felix Nitsch Christoph Schimeczek Johannes Kochems Kristina Nienhaus Evelyn Sperber Aboubakr Achraf El Ghazi Seyedfarzad Sarfarazi | Published Thursday, February 03, 2022AMIRIS is the Agent-based Market model for the Investigation of Renewable and Integrated energy Systems.
It is an agent-based simulation of electricity markets and their actors.
AMIRIS enables researches to analyse and evaluate energy policy instruments and their impact on the actors involved in the simulation context.
Different prototypical agents on the electricity market interact with each other, each employing complex decision strategies.
AMIRIS allows to calculate the impact of policy instruments on economic performance of power plant operators and marketers.
…
Peer reviewed Agent-based model to simulate equilibria and regime shifts emerged in lake ecosystems
no contributors listed | Published Tuesday, January 25, 2022(An empty output folder named “NETLOGOexperiment” in the same location with the LAKEOBS_MIX.nlogo file is required before the model can be run properly)
The model is motivated by regime shifts (i.e. abrupt and persistent transition) revealed in the previous paleoecological study of Taibai Lake. The aim of this model is to improve a general understanding of the mechanism of emergent nonlinear shifts in complex systems. Prelimnary calibration and validation is done against survey data in MLYB lakes. Dynamic population changes of function groups can be simulated and observed on the Netlogo interface.
Main functional groups in lake ecosystems were modelled as super-individuals in a space where they interact with each other. They are phytoplankton, zooplankton, submerged macrophyte, planktivorous fish, herbivorous fish and piscivorous fish. The relationships between these functional groups include predation (e.g. zooplankton-phytoplankton), competition (phytoplankton-macrophyte) and protection (macrophyte-zooplankton). Each individual has properties in size, mass, energy, and age as physiological variables and reproduce or die according to predefined criteria. A system dynamic model was integrated to simulate external drivers.
Set biological and environmental parameters using the green sliders first. If the data of simulation are to be logged, set “Logdata” as true and input the name of the file you want the spreadsheet(.csv) to be called. You will need create an empty folder called “NETLOGOexperiment” in the same level and location with the LAKEOBS_MIX.nlogo file. Press “setup” to initialise the system and “go” to start life cycles.
3D Urban Traffic Simulator (ABM) in Unity
Daniel Birks Sedar Olmez Obi Thompson Sargoni Alison Heppenstall Annabel Whipp Ed Manley | Published Friday, January 22, 2021 | Last modified Monday, March 22, 2021The Urban Traffic Simulator is an agent-based model developed in the Unity platform. The model allows the user to simulate several autonomous vehicles (AVs) and tune granular parameters such as vehicle downforce, adherence to speed limits, top speed in mph and mass. The model allows researchers to tune these parameters, run the simulator for a given period and export data from the model for analysis (an example is provided in Jupyter Notebook).
The data the model is currently able to output are the following:
…
Agent Based Integrated Assessment Model
Marcin Czupryna | Published Saturday, June 27, 2020Agent based approach to the class of the Integrated Assessment Models. An agent-based model (ABM) that focuses on the energy sector and climate relevant facts in a detailed way while being complemented with consumer goods, labour and capital markets to a minimal necessary extent.
Displaying 10 of 68 results energy clear search


