Our mission is to help computational modelers develop, document, and share their computational models in accordance with community standards and good open science and software engineering practices. Model authors can publish their model source code in the Computational Model Library with narrative documentation as well as metadata that supports open science and emerging norms that facilitate software citation, computational reproducibility / frictionless reuse, and interoperability. Model authors can also request private peer review of their computational models. Models that pass peer review receive a DOI once published.
All users of models published in the library must cite model authors when they use and benefit from their code.
Please check out our model publishing tutorial and feel free to contact us if you have any questions or concerns about publishing your model(s) in the Computational Model Library.
Displaying 10 of 97 results for "Evelyn%20Sperber" clear search
A Bottom-Up Simulation on Competition and Displacement of Online Interpersonal Communication Platforms
great-sage-futao | Published Tuesday, December 31, 2019 | Last modified Tuesday, December 31, 2019This model aims to simulate Competition and Displacement of Online Interpersonal Communication Platforms process from a bottom-up angle. Individual interpersonal communication platform adoption and abandonment serve as the micro-foundation of the simulation model. The evolution mode of platform user online communication network determines how present platform users adjust their communication relationships as well as how new users join that network. This evolution mode together with innovations proposed by individual interpersonal communication platforms would also have impacts on the platform competition and displacement process and result by influencing individual platform adoption and abandonment behaviors. Three scenes were designed to simulate some common competition situations occurred in the past and current time, that two homogeneous interpersonal communication platforms competed with each other when this kind of platforms first came into the public eye, that a late entrant platform with a major innovation competed with the leading incumbent platform during the following days, as well as that both the leading incumbent and the late entrant continued to propose many small innovations to compete in recent days, respectively.
Initial parameters are as follows: n(Nmax in the paper), denotes the final node number of the online communication network node. mi (m in the paper), denotes the initial degree of those initial network nodes and new added nodes. pc(Pc in the paper), denotes the proportion of links to be removed and added in each epoch. pst(Pv in the paper), denotes the proportion of nodes with a viscosity to some platforms. comeintime(Ti in the paper), denotes the epoch when Platform 2 joins the market. pit(Pi in the paper), denotes the proportion of nodes adopting Platform 2 immediately at epoch comeintime(Ti). ct(Ct in the paper), denotes the Innovation Effective Period length. In Scene 2, There is only one major platform proposed by Platform 2, and ct describes that length. However, in Scene 3, Platform 2 and 1 will propose innovations alternately. And so, we set ct=10000 in simulation program, and every jtt epochs, we alter the innovation proposer from one platform to the other. Hence in this scene, jtt actually denotes the Innovation Effective Period length instead of ct.
How does knowledge infrastructure mobilization influence the safe operating space of regulated exploited ecosystems?
Jean-Denis Mathias | Published Tuesday, July 17, 2018Decision-makers often have to act before critical times to avoid the collapse of ecosystems using knowledge \textcolor{red}{that can be incomplete or biased}. Adaptive management may help managers tackle such issues. However, because the knowledge infrastructure required for adaptive management may be mobilized in several ways, we study the quality and the quantity of knowledge provided by this knowledge infrastructure. In order to analyze the influence of mobilized knowledge, we study how the following typology of knowledge and its use may impact the safe operating space of exploited ecosystems: 1) knowledge of the past based on a time series distorted by measurement errors; 2) knowledge of the current systems’ dynamics based on the representativeness of the decision-makers’ mental models of the exploited ecosystem; 3) knowledge of future events based on decision-makers’ likelihood estimates of extreme events based on modeling infrastructure (models and experts to interpret them) they have at their disposal. We consider different adaptive management strategies of a general regulated exploited ecosystem model and we characterize the robustness of these strategies to biased knowledge. Our results show that even with significant mobilized knowledge and optimal strategies, imperfect knowledge may still shrink the safe operating space of the system leading to the collapse of the system. However, and perhaps more interestingly, we also show that in some cases imperfect knowledge may unexpectedly increase the safe operating space by suggesting cautious strategies.
The code enables to calculate the safe operating spaces of different managers in the case of biased and unbiased knowledge.
Can ethnic tolerance curb self-reinforcing school segregation? A theoretical Agent Based Model
Lucas Sage Andreas Flache | Published Monday, August 10, 2020Schelling and Sakoda prominently proposed computational models suggesting that strong ethnic residential segregation can be the unintended outcome of a self-reinforcing dynamic driven by choices of individuals with rather tolerant ethnic preferences. There are only few attempts to apply this view to school choice, another important arena in which ethnic segregation occurs. In the current paper, we explore with an agent-based theoretical model similar to those proposed for residential segregation, how ethnic tolerance among parents can affect the level of school segregation. More specifically, we ask whether and under which conditions school segregation could be reduced if more parents hold tolerant ethnic preferences. We move beyond earlier models of school segregation in three ways. First, we model individual school choices using a random utility discrete choice approach. Second, we vary the pattern of ethnic segregation in the residential context of school choices systematically, comparing residential maps in which segregation is unrelated to parents’ level of tolerance to residential maps reflecting their ethnic preferences. Third, we introduce heterogeneity in tolerance levels among parents belonging to the same group. Our simulation experiments suggest that ethnic school segregation can be a very robust phenomenon, occurring even when about half of the population prefers mixed to segregated schools. However, we also identify a “sweet spot” in the parameter space in which a larger proportion of tolerant parents makes the biggest difference. This is the case when parents have moderate preferences for nearby schools and there is only little residential segregation. Further experiments are presented that unravel the underlying mechanisms.
Peer reviewed TRANSOPE: a multi-agent model to simulate outsourcing networks in road freight transport.
Aitor Salas-Peña Blanca Rosa Cases Gutiérrez | Published Friday, October 21, 2022A road freight transport (RFT) operation involves the participation of several types of companies in its execution. The TRANSOPE model simulates the subcontracting process between 3 types of companies: Freight Forwarders (FF), Transport Companies (TC) and self-employed carriers (CA). These companies (agents) form transport outsourcing chains (TOCs) by making decisions based on supplier selection criteria and transaction acceptance criteria. Through their participation in TOCs, companies are able to learn and exchange information, so that knowledge becomes another important factor in new collaborations. The model can replicate multiple subcontracting situations at a local and regional geographic level.
The succession of n operations over d days provides two types of results: 1) Social Complex Networks, and 2) Spatial knowledge accumulation environments. The combination of these results is used to identify the emergence of new logistics clusters. The types of actors involved as well as the variables and parameters used have their justification in a survey of transport experts and in the existing literature on the subject.
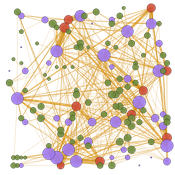
As a result of a preferential selection process, the distribution of activity among agents shows to be highly uneven. The cumulative network resulting from the self-organisation of the system suggests a structure similar to scale-free networks (Albert & Barabási, 2001). In this sense, new agents join the network according to the needs of the market. Similarly, the network of preferential relationships persists over time. Here, knowledge transfer plays a key role in the assignment of central connector roles, whose participation in the outsourcing network is even more decisive in situations of scarcity of transport contracts.
The cultural multiplier of climate policy
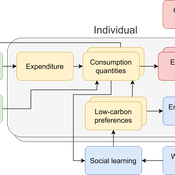
Daniel Torren-Peraire | Published Thursday, October 31, 2024For deep decarbonisation, the design of climate policy needs to account for consumption choices being influenced not only by pricing but also by social learning. This involves changes that pertain to the whole spectrum of consumption, possibly involving shifts in lifestyles. In this regard, it is crucial to consider not just short-term social learning processes but also slower, longer-term, cultural change. Against this background, we analyse the interaction between climate policy and cultural change, focusing on carbon taxation. We extend the notion of “social multiplier” of environmental policy derived in an earlier study to the context of multiple consumer needs while allowing for behavioural spillovers between these, giving rise to a “cultural multiplier”. We develop a model to assess how this cultural multiplier contributes to the effectiveness of carbon taxation. Our results show that the cultural multiplier stimulates greater low-carbon consumption compared to fixed preferences. The model results are of particular relevance for policy acceptance due to the cultural multiplier being most effective at low-carbon tax values, relative to a counter-case of short-term social interactions. Notably, at high carbon tax levels, the distinction between social and cultural multiplier effects diminishes, as the strong price signal drives even resistant individuals toward low-carbon consumption. By varying socio-economic conditions, such as substitutability between low- and high-carbon goods, social network structure, proximity of like-minded individuals and the richness of consumption lifestyles, the model provides insight into how cultural change can be leveraged to induce maximum effectiveness of climate policy.
Peer reviewed Casting: A Bio-Inspired Method for Restructuring Machine Learning Ensembles
Colin Lynch Bryan Daniels | Published Thursday, September 18, 2025The wisdom of the crowd refers to the phenomenon in which a group of individuals, each making independent decisions, can collectively arrive at highly accurate solutions—often more accurate than any individual within the group. This principle relies heavily on independence: if individual opinions are unbiased and uncorrelated, their errors tend to cancel out when averaged, reducing overall bias. However, in real-world social networks, individuals are often influenced by their neighbors, introducing correlations between decisions. Such social influence can amplify biases, disrupting the benefits of independent voting. This trade-off between independence and interdependence has striking parallels to ensemble learning methods in machine learning. Bagging (bootstrap aggregating) improves classification performance by combining independently trained weak learners, reducing bias. Boosting, on the other hand, explicitly introduces sequential dependence among learners, where each learner focuses on correcting the errors of its predecessors. This process can reinforce biases present in the data even if it reduces variance. Here, we introduce a new meta-algorithm, casting, which captures this biological and computational trade-off. Casting forms partially connected groups (“castes”) of weak learners that are internally linked through boosting, while the castes themselves remain independent and are aggregated using bagging. This creates a continuum between full independence (i.e., bagging) and full dependence (i.e., boosting). This method allows for the testing of model capabilities across values of the hyperparameter which controls connectedness. We specifically investigate classification tasks, but the method can be used for regression tasks as well. Ultimately, casting can provide insights for how real systems contend with classification problems.

Peer reviewed AgModel
Isaac Ullah | Published Friday, December 06, 2024AgModel is an agent-based model of the forager-farmer transition. The model consists of a single software agent that, conceptually, can be thought of as a single hunter-gather community (i.e., a co-residential group that shares in subsistence activities and decision making). The agent has several characteristics, including a population of human foragers, intrinsic birth and death rates, an annual total energy need, and an available amount of foraging labor. The model assumes a central-place foraging strategy in a fixed territory for a two-resource economy: cereal grains and prey animals. The territory has a fixed number of patches, and a starting number of prey. While the model is not spatially explicit, it does assume some spatiality of resources by including search times.
Demographic and environmental components of the simulation occur and are updated at an annual temporal resolution, but foraging decisions are “event” based so that many such decisions will be made in each year. Thus, each new year, the foraging agent must undertake a series of optimal foraging decisions based on its current knowledge of the availability of cereals and prey animals. Other resources are not accounted for in the model directly, but can be assumed for by adjusting the total number of required annual energy intake that the foraging agent uses to calculate its cereal and prey animal foraging decisions. The agent proceeds to balance the net benefits of the chance of finding, processing, and consuming a prey animal, versus that of finding a cereal patch, and processing and consuming that cereal. These decisions continue until the annual kcal target is reached (balanced on the current human population). If the agent consumes all available resources in a given year, it may “starve”. Starvation will affect birth and death rates, as will foraging success, and so the population will increase or decrease according to a probabilistic function (perturbed by some stochasticity) and the agent’s foraging success or failure. The agent is also constrained by labor caps, set by the modeler at model initialization. If the agent expends its yearly budget of person-hours for hunting or foraging, then the agent can no longer do those activities that year, and it may starve.
Foragers choose to either expend their annual labor budget either hunting prey animals or harvesting cereal patches. If the agent chooses to harvest prey animals, they will expend energy searching for and processing prey animals. prey animals search times are density dependent, and the number of prey animals per encounter and handling times can be altered in the model parameterization (e.g. to increase the payoff per encounter). Prey animal populations are also subject to intrinsic birth and death rates with the addition of additional deaths caused by human predation. A small amount of prey animals may “migrate” into the territory each year. This prevents prey animals populations from complete decimation, but also may be used to model increased distances of logistic mobility (or, perhaps, even residential mobility within a larger territory).
…
The role of spatial foresight in models of hominin dispersal
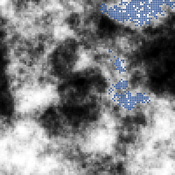
Colin Wren | Published Monday, February 24, 2014 | Last modified Monday, July 14, 2014The natural selection of foresight, an accuracy at assess the environment, under degrees of environmental heterogeneity. The model is designed to connect local scale mobility, from foraging, with the global scale phenomenon of population dispersal.
A Model of Iterated Ultimatum game
Andrea Scalco | Published Tuesday, February 24, 2015 | Last modified Monday, March 09, 2015The simulation generates two kinds of agents, whose proposals are generated accordingly to their selfish or selfless behaviour. Then, agents compete in order to increase their portfolio playing the ultimatum game with a random-stranger matching.
The Evolution of Tribalism: A Social-Ecological Model of Cooperation and Inter-group Conflict Under Pastoralism
Nicholas Seltzer | Published Monday, January 21, 2019This study investigates a possible nexus between inter-group competition and intra-group cooperation, which may be called “tribalism.” Building upon previous studies demonstrating a relationship between the environment and social relations, the present research incorporates a social-ecological model as a mediating factor connecting both individuals and communities to the environment. Cyclical and non-cyclical fluctuation in a simple, two-resource ecology drive agents to adopt either “go-it-alone” or group-based survival strategies via evolutionary selection. Novelly, this simulation employs a multilevel selection model allowing group-level dynamics to exert downward selective pressures on individuals’ propensity to cooperate within groups. Results suggest that cooperation and inter-group conflict are co-evolved in a triadic relationship with the environment. Resource scarcity increases inter-group competition, especially when resources are clustered as opposed to widely distributed. Moreover, the tactical advantage of cooperation in the securing of clustered resources enhanced selective pressure on cooperation, even if that implies increased individual mortality for the most altruistic warriors. Troubling, these results suggest that extreme weather, possibly as a result of climate change, could exacerbate conflict in sensitive, weather-dependent social-ecologies—especially places like the Horn of Africa where ecologically sensitive economic modalities overlap with high-levels of diversity and the wide-availability of small arms. As well, global development and foreign aid strategists should consider how plans may increase the value of particular locations where community resources are built or aid is distributed, potentially instigating tribal conflict. In sum, these factors, interacting with pre-existing social dynamics dynamics, may heighten inter-ethnic or tribal conflict in pluralistic but otherwise peaceful communities.
For special issue submission in JASSS.
Displaying 10 of 97 results for "Evelyn%20Sperber" clear search