About the CoMSES Model Library more info
Our mission is to help computational modelers at all levels engage in the establishment and adoption of community standards and good practices for developing and sharing computational models. Model authors can freely publish their model source code in the Computational Model Library alongside narrative documentation, open science metadata, and other emerging open science norms that facilitate software citation, reproducibility, interoperability, and reuse. Model authors can also request peer review of their computational models to receive a DOI.
All users of models published in the library must cite model authors when they use and benefit from their code.
Please check out our model publishing tutorial and contact us if you have any questions or concerns about publishing your model(s) in the Computational Model Library.
We also maintain a curated database of over 7500 publications of agent-based and individual based models with additional detailed metadata on availability of code and bibliometric information on the landscape of ABM/IBM publications that we welcome you to explore.
Displaying 10 of 745 results for "Jon Norberg" clear search
Pedestrian model
Dana Kaziyeva Petra Stutz Gudrun Wallentin Martin Loidl | Published Monday, August 07, 2023The model generates disaggregated traffic flows of pedestrians, simulating their daily mobility behaviour represented as probabilistic rules. Various parameters of physical infrastructure and travel behaviour can be altered and tested. This allows predicting potential shifts in traffic dynamics in a simulated setting. Moreover, assumptions in decision-making processes are general for mid-sized cities and can be applied to similar areas.
Together with the model files, there is the ODD protocol with the detailed description of model’s structure. Check the associated publication for results and evaluation of the model.
Installation
Download GAMA-platform (GAMA1.8.2 with JDK version) from https://gama-platform.github.io/. The platform requires a minimum of 4 GB of RAM.
…
DARTS: an agent-based model of the global food system for studying its resilience to shocks
Hubert Fonteijn | Published Wednesday, November 22, 2023DARTS simulates food systems in which agents produce, consume and trade food. Here, food is a summary item that roughly corresponds to commodity food types (e.g. rice). No other food types are taken into account. Each food system (World) consists of its own distribution of agents, regions and connections between agents. Agents differ in their ability to produce food, earn off-farm income and trade food. The agents aim to satisfy their food requirements (which are fixed and equal across agents) by either their own food production or by food purchases. Each simulation step represents one month, in which agents can produce (if they have productive capacity and it is a harvest month for their region), earn off-farm income, trade food (both buy and sell) and consume food. We evaluate the performance of the food system by averaging the agents’ food satisfaction, which is defined as the ratio of the food consumed by each agent at the end of each month divided by her food requirement. At each step, any of the abovementioned attributes related to the agents’ ability to satisfy their food requirement can (temporarily) be shocked. These shocks include reducing the amount of food they produce, removing their ability to trade locally or internationally and reducing their cash savings. Food satisfaction is quantified (both immediately after the shock and in the year following the shock) to evaluate food security of a particular food system, both at the level of agent types (e.g. the urban poor and the rural poor) and at the systems level. Thus, the effects of shocks on food security can be related to the food system’s structure.
Model of communication between two groups of managers in the course of project implementation
Smarzhevskiy Ivan | Published Monday, December 07, 2020This is a simulation model of communication between two groups of managers in the course of project implementation. The “world” of the model is a space of interaction between project participants, each of which belongs either to a group of work performers or to a group of customers. Information about the progress of the project is publicly available and represents the deviation Earned value (EV) from the planned project value (cost baseline).
The key elements of the model are 1) persons belonging to a group of customers or performers, 2) agents that are communication acts. The life cycle of persons is equal to the time of the simulation experiment, the life cycle of the communication act is 3 periods of model time (for the convenience of visualizing behavior during the experiment). The communication act occurs at a specific point in the model space, the coordinates of which are realized as random variables. During the experiment, persons randomly move in the model space. The communication act involves persons belonging to a group of customers and a group of performers, remote from the place of the communication act at a distance not exceeding the value of the communication radius (MaxCommRadius), while at least one representative from each of the groups must participate in the communication act. If none are found, the communication act is not carried out. The number of potential communication acts per unit of model time is a parameter of the model (CommPerTick).
The managerial sense of the feedback is the stimulating effect of the positive value of the accumulated communication complexity (positive background of the project implementation) on the productivity of the performers. Provided there is favorable communication (“trust”, “mutual understanding”) between the customer and the contractor, it is more likely that project operations will be performed with less lag behind the plan or ahead of it.
The behavior of agents in the world of the model (change of coordinates, visualization of agents’ belonging to a specific communicative act at a given time, etc.) is not informative. Content data are obtained in the form of time series of accumulated communicative complexity, the deviation of the earned value from the planned value, average indicators characterizing communication - the total number of communicative acts and the average number of their participants, etc. These data are displayed on graphs during the simulation experiment.
The control elements of the model allow seven independent values to be varied, which, even with a minimum number of varied values (three: minimum, maximum, optimum), gives 3^7 = 2187 different variants of initial conditions. In this case, the statistical processing of the results requires repeated calculation of the model indicators for each grid node. Thus, the set of varied parameters and the range of their variation is determined by the logic of a particular study and represents a significant narrowing of the full set of initial conditions for which the model allows simulation experiments.
…
PopComp
Andre Costopoulos | Published Thursday, December 10, 2020PopComp by Andre Costopoulos 2020
[email protected]
Licence: DWYWWI (Do whatever you want with it)
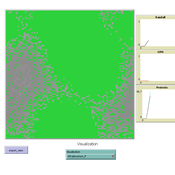
I use Netlogo to build a simple environmental change and population expansion and diffusion model. Patches have a carrying capacity and can host two kinds of populations (APop and BPop). Each time step, the carrying capacity of each patch has a given probability of increasing or decreasing up to a maximum proportion.
…
A Complex Model of Voter Turnout
Bruce Edmonds Laurence Lessard-Phillips Ed Fieldhouse | Published Monday, October 13, 2014 | Last modified Tuesday, August 18, 2015This is a complex “Data Integration Model”, following a “KIDS” rather than a “KISS” methodology - guided by the available evidence. It looks at the complex mix of social processes that may determine why people vote or not.
Generic servicising model (SPREE project)
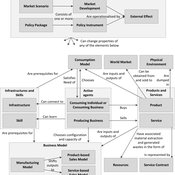
Reinier Van Der Veen Kasper H Kisjes Igor Nikolic | Published Wednesday, August 26, 2015 | Last modified Wednesday, September 28, 2016This generic agent-based model allows the user to simulate and explore the influence of servicising policies on the uptake of servicising and on economic, environmental and social effects, notably absolute decoupling.
How to not get stuck – an ant model showing how negative feedback due to crowding maintains flexibility in ant foraging
Tomer Czaczkes | Published Thursday, December 17, 2015Positive feedback can lead to “trapping” in local optima. Adding a simple negative feedback effect, based on ant behaviour, prevents this trapping
04 TpLab V2.08 – Teleological Pruning Laboratory
Garvin Boyle | Published Saturday, April 15, 2017Our societal belief systems are pruned by evolution, informing our unsustainable economies. This is one of a series of models exploring the dynamics of sustainable economics – PSoup, ModEco, EiLab, OamLab, MppLab, TpLab, CmLab.
Modeling a Victim-Centered Approach for Detection of Human Trafficking Victims within Migration Flows
Brant M Horio Kyle Ballard | Published Saturday, September 23, 2017The model employs an agent-based model for exploring the victim-centered approach to identifying human trafficking and the approach’s effectiveness in an abstract representation of migrant flows.
MEGADAPT - Socio-hydrological risk model - Theoretical (no data) implementation
Andres Baeza-Castro Luis Bojorquez Marco Janssen Hallie Eakin | Published Wednesday, February 06, 2019The model simulates the decisions of residents and a water authority to respond to socio-hydrological hazards. Residents from neighborhoods are located in a landscape with topographic complexity and two problems: water scarcity in the peripheral neighborhoods at high altitude and high risk of flooding in the lowlands, at the core of the city. The role of the water authority is to decide where investments in infrastructure should be allocated to reduce the risk to water scarcity and flooding events in the city, and these decisions are made via a multi-objective site selection procedure. This procedure accounts for the interdependencies and feedback between the urban landscape and a policy scenario that defines the importance, or priorities, that the authority places on four criteria.
Neighborhoods respond to the water authority decisions by protesting against the lack of investment and the level of exposure to water scarcity and flooding. Protests thus simulate a form of feedback between local-level outcomes (flooding and water scarcity) and higher-level decision-making. Neighborhoods at high altitude are more likely to be exposed to water scarcity and lack infrastructure, whereas neighborhoods in the lowlands tend to suffer from recurrent flooding. The frequency of flooding is also a function of spatially uniform rainfall events. Likewise, neighborhoods at the periphery of the urban landscape lack infrastructure and suffer from chronic risk of water scarcity.
The model simulates the coupling between the decision-making processes of institutional actors, socio-political processes and infrastructure-related hazards. In the documentation, we describe details of the implementation in NetLogo, the description of the procedures, scheduling, and the initial conditions of the landscape and the neighborhoods.
This work was supported by the National Science Foundation under Grant No. 1414052, CNH: The Dynamics of Multi-Scalar Adaptation in Megacities (PI Hallie Eakin).
Displaying 10 of 745 results for "Jon Norberg" clear search


