About the CoMSES Model Library more info
Our mission is to help computational modelers at all levels engage in the establishment and adoption of community standards and good practices for developing and sharing computational models. Model authors can freely publish their model source code in the Computational Model Library alongside narrative documentation, open science metadata, and other emerging open science norms that facilitate software citation, reproducibility, interoperability, and reuse. Model authors can also request peer review of their computational models to receive a DOI.
All users of models published in the library must cite model authors when they use and benefit from their code.
Please check out our model publishing tutorial and contact us if you have any questions or concerns about publishing your model(s) in the Computational Model Library.
We also maintain a curated database of over 7500 publications of agent-based and individual based models with additional detailed metadata on availability of code and bibliometric information on the landscape of ABM/IBM publications that we welcome you to explore.
Displaying 10 of 71 results for "P Dykstra" clear search
cournot simulation
Timothy Kochanski | Published Friday, October 22, 2010 | Last modified Saturday, April 27, 2013Cournot simulation with innovation
A formalized implementation of Halstead and O’Shea’s Bad Year Economics. The agent population uses one of four resilience strategies in an attempt to cope with a dynamic environment of stresses and shocks.
Peer reviewed SequiaBasalto model
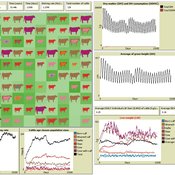
Diego J. Soler-Navarro Alicia Tenza Peral Francisco Dieguez Cameroni Pierre Bommel Marco Janssen Irene Perez Ibarra | Published Friday, May 26, 2023This is a replication of the SequiaBasalto model, originally built in Cormas by Dieguez Cameroni et al. (2012, 2014, Bommel et al. 2014 and Morales et al. 2015). The model aimed to test various adaptations of livestock producers to the drought phenomenon provoked by climate change. For that purpose, it simulates the behavior of one livestock farm in the Basaltic Region of Uruguay. The model incorporates the price of livestock, fodder and paddocks, as well as the growth of grass as a function of climate and seasons (environmental submodel), the life cycle of animals feeding on the pasture (livestock submodel), and the different strategies used by farmers to manage their livestock (management submodel). The purpose of the model is to analyze to what degree the common management practices used by farmers (i.e., proactive and reactive) to cope with seasonal and interannual climate variations allow to maintain a sustainable livestock production without depleting the natural resources (i.e., pasture). Here, we replicate the environmental and livestock submodel using NetLogo.
One year is 368 days. Seasons change every 92 days. Each day begins with the growth of grass as a function of climate and season. This is followed by updating the live weight of cows according to the grass height of their patch, and grass consumption, which is determined based on the updated live weight. After consumption, cows grow and reproduce, and a new grass height is calculated. Cows then move to the patch with less cows and with the highest grass height. This updated grass height value will be the initial grass height for the next day.
Superiority Bias and Communication Noise in a Model of Collective Problem Solving
Amin Boroomand Paul Smaldino | Published Sunday, May 01, 2022This model aims to examine how different levels of communication noise and superiority bias affect team performance when solving problems collectively. We used a networked agent-based model of collective problem solving in which agents explore the NK landscape for a better solution and communicate with each other regarding their current solutions. We compared the team performance in solving problems collectively at different levels of self-superiority bias when facing simple and complex problems. Additionally, we addressed the effect of different levels of communication noise on the team’s outcome
Peer reviewed Yards
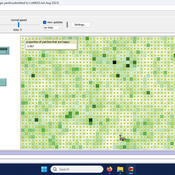
Emily Minor Soraida Garcia srailsback Philip Johnson | Published Thursday, November 02, 2023This is a model of plant communities in urban and suburban residential neighborhoods. These plant communities are of interest because they provide many benefits to human residents and also provide habitat for wildlife such as birds and pollinators. The model was designed to explore the social factors that create spatial patterns in biodiversity in yards and gardens. In particular, the model was originally developed to determine whether mimicry behaviors–-or neighbors copying each other’s yard design–-could produce observed spatial patterns in vegetation. Plant nurseries and socio-economic constraints were also added to the model as other potential sources of spatial patterns in plant communities.
The idea for the model was inspired by empirical patterns of spatial autocorrelation that have been observed in yard vegetation in Chicago, Illinois (USA), and other cities, where yards that are closer together are more similar than yards that are farther apart. The idea is further supported by literature that shows that people want their yards to fit into their neighborhood. Currently, the yard attribute of interest is the number of plant species, or species richness. Residents compare the richness of their yards to the richness of their neighbors’ yards. If a resident’s yard is too different from their neighbors, the resident will be unhappy and change their yard to make it more similar.
The model outputs information about the diversity and identity of plant species in each yard. This can be analyzed to look for spatial autocorrelation patterns in yard diversity and to explore relationships between mimicry behaviors, yard diversity, and larger scale diversity.
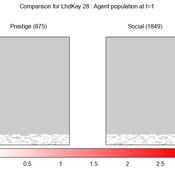
We provide a theory-grounded, socio-geographic agent-based model to present a possible explanation for human movement in the Adriatic region within the Cetina phenomenon.
Focusing on ideas of social capital theory from Piere Bordieu (1986), we implement agent mobility in an abstract geography based on cultural capital (prestige) and social capital (social position). Agents hold myopic representations of social (Schaff, 2016) and geographical networks and decide in a heuristic way on moving (and where) or staying.
The model is implemented in a fork of the Laboratory for Simulation Development (LSD), appended with GIS capabilities (Pereira et. al. 2020).
Peer reviewed Virus Transmission with Super-spreaders
J M Applegate | Published Saturday, September 11, 2021A curious aspect of the Covid-19 pandemic is the clustering of outbreaks. Evidence suggests that 80\% of people who contract the virus are infected by only 19% of infected individuals, and that the majority of infected individuals faile to infect another person. Thus, the dispersion of a contagion, $k$, may be of more use in understanding the spread of Covid-19 than the reproduction number, R0.
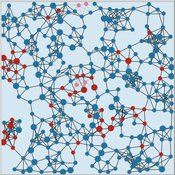
The Virus Transmission with Super-spreaders model, written in NetLogo, is an adaptation of the canonical Virus Transmission on a Network model and allows the exploration of various mitigation protocols such as testing and quarantines with both homogenous transmission and heterogenous transmission.
The model consists of a population of individuals arranged in a network, where both population and network degree are tunable. At the start of the simulation, a subset of the population is initially infected. As the model runs, infected individuals will infect neighboring susceptible individuals according to either homogenous or heterogenous transmission, where heterogenous transmission models super-spreaders. In this case, k is described as the percentage of super-spreaders in the population and the differing transmission rates for super-spreaders and non super-spreaders. Infected individuals either recover, at which point they become resistant to infection, or die. Testing regimes cause discovered infected individuals to quarantine for a period of time.
ABM for Underwater optical wireless communication in a water tank
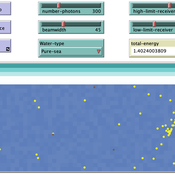
Mohamed ABID | Published Sunday, May 29, 2022This model simulates the propagation of photons in a water tank. A source of light emits an impulse of photons with equal energy represented by yellow dots. These photons are then scattered by water particles before possibly reaching the photo-detector represented by a gray line. Different types of water are considered. For each one of them we calculate the total received energy.
The water tank is represented by a blue rectangle with fixed dimensions. It’s exposed to the air interface and has totally absorbent barriers. Four types of water are supported. Each one is characterized by its absorption and scattering coefficients.
At the source, the photons are generated uniformly with a random direction within the beamwidth. Each photon travels a random distance drawn from a distribution depending on the water characteristics before encountering a water particle.
Based on the updated position of the photon, three situations may occur:
-The photon hits the barrier of the tank on its trajectory. In this case it’s considered as lost since the barriers are assumed totally absorbent.
…
BEEHAVE Extension: Varroa mite control within Good Beekeeping Practice in Germany
Isabel Schödl Jürgen Groeneveld Volker Grimm | Published Wednesday, May 25, 2022 | Last modified Monday, November 07, 2022The western honey bee Apis mellifera is the most important pollinator in the world. The biggest threat to managed honey bees is the ectoparasitic mite Varroa destructor and the viruses DWV (Deformed Wing Virus) and APV (Acute Paralysis Virus) it transmits. Untreated honey bee colonies are expected to die within one to three years. This led to the development of strategies for beekeepers to control the Varroa mite in honey bee colonies and ensure the health and survival of their bee colonies, so called Good Beekeeping Practice. The aim of the extension of BEEHAVE was to represent the Good Beekeeping Practice of Varroa control in Germany. The relevant measures within the Varroa control strategies are drone brood removal as a Varroa trap and the treatment of bee colonies with organic acaricides (formic and oxalic acid) to kill the mites. This extension improves BEEHAVE and builds a bridge between beekeepers in practice and in the modelling world. It vastly contributes to the future use of BEEHAVE in beekeeping education in Germany.
Agent-Based Model for Multiple Team Membership (ABMMTM)
Andrew Collins | Published Thursday, April 03, 2025The Agent-Based Model for Multiple Team Membership (ABMMTM) simulates design teams searching for viable design solutions, for a large design project that requires multiple design teams that are working simultaneously, under different organizational structures; specifically, the impact of multiple team membership (MTM). The key mechanism under study is how individual agent-level decision-making impacts macro-level project performance, specifically, wage cost. Each agent follows a stochastic learning approach, akin to simulated annealing or reinforcement learning, where they iteratively explore potential design solutions. The agent evaluates new solutions based on a random-walk exploration, accepting improvements while rejecting inferior designs. This iterative process simulates real-world problem-solving dynamics where designers refine solutions based on feedback.
As a proof-of-concept demonstration of assessing the macro-level effects of MTM in organizational design, we developed this agent-based simulation model which was used in a simulation experiment. The scenario is a system design project involving multiple interdependent teams of engineering designers. In this scenario, the required system design is split into three separate but interdependent systems, e.g., the design of a satellite could (trivially) be split into three components: power source, control system, and communication systems; each of three design team is in charge of a design of one of these components. A design team is responsible for ensuring its proposed component’s design meets the design requirement; they are not responsible for the design requirements of the other components. If the design of a given component does not affect the design requirements of the other components, we call this the uncoupled scenario; otherwise, it is a coupled scenario.
Displaying 10 of 71 results for "P Dykstra" clear search
