About the CoMSES Model Library more info
Our mission is to help computational modelers at all levels engage in the establishment and adoption of community standards and good practices for developing and sharing computational models. Model authors can freely publish their model source code in the Computational Model Library alongside narrative documentation, open science metadata, and other emerging open science norms that facilitate software citation, reproducibility, interoperability, and reuse. Model authors can also request peer review of their computational models to receive a DOI.
All users of models published in the library must cite model authors when they use and benefit from their code.
Please check out our model publishing tutorial and contact us if you have any questions or concerns about publishing your model(s) in the Computational Model Library.
We also maintain a curated database of over 7500 publications of agent-based and individual based models with additional detailed metadata on availability of code and bibliometric information on the landscape of ABM/IBM publications that we welcome you to explore.
Displaying 10 of 875 results for "P Van Geert" clear search
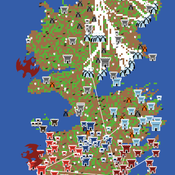
Game of Thrones model
Claudine Gravel-Miguel Sean Bergin | Published Sunday, January 03, 2021 | Last modified Sunday, January 03, 2021This model slowly evolves to become Westeros, with houses fighting for the thrones, and whitewalkers trying to kill all living things. You can download each version to see the evolution of the code, from the Wolf Sheep Predation model to the Game of Thrones model. If you are only interested in the end product, simply download the latest version.
For instructions on each step, see: https://claudinegravelmigu.wixsite.com/got-abm
Adaptive model of a consumer advice network
Peng Shao | Published Monday, May 14, 2018In the consumer advice network, users with connections can interact with each other, and the network topology will change during the opinion interaction. When the opinion distance from i to j is greater than the confidence threshold, the two consumers cannot exchange opinions, and the link between them will disconnect with probability DE. Then, a link from node i to node k is established with probability CE and node i learning opinion from node k.
Rangeland and evolution of management styles
Marco Janssen | Published Tuesday, January 14, 2020Provided is a landscape of properties where pastoralists make decisions how much livestock they put on their property and how much to suppress fire from occuring. Rangelands can be grass dominated, or unproductive shrubb dominated. Overgrazing and fire suppresion lead to shrub dominated landscapes. What management strategies evolve, and how is this impacted by policies?
The model is discussed in Introduction to Agent-Based Modeling by Marco Janssen. For more information see https://intro2abm.com/.
Simulating the Cinema Market: How Cross-Cultural Differences in Social Influence Explain Box Office Distributions
Sebastiano Delre | Published Thursday, February 11, 2010 | Last modified Saturday, April 27, 2013This model simulates the motion picture industry and tests how social influences affect market shares. It is empirically validated at the micro level by a cross-cultural survey.
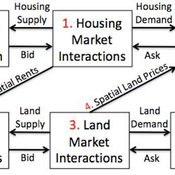
Coupled Housing and Land Markets (CHALMS)
Nicholas Magliocca Virginia Mcconnell Margaret Walls | Published Friday, November 02, 2012 | Last modified Monday, October 27, 2014CHALMS simulates housing and land market interactions between housing consumers, developers, and farmers in a growing ex-urban area.
Peer reviewed MOOvPOPsurveillance
Aniruddha Belsare Matthew Gompper Joshua J Millspaugh | Published Tuesday, April 04, 2017 | Last modified Tuesday, May 12, 2020MOOvPOPsurveillance was developed as a tool for wildlife agencies to guide collection and analysis of disease surveillance data that relies on non-probabilistic methods like harvest-based sampling.
Risks and Hedonics in Empirical Agent-based land market (RHEA) model
Koen de Koning Tatiana Filatova | Published Monday, April 01, 2019RHEA aims to provide a methodological platform to simulate the aggregated impact of households’ residential location choice and dynamic risk perceptions in response to flooding on urban land markets. It integrates adaptive behaviour into the spatial landscape using behavioural theories and empirical data sources. The platform can be used to assess: how changes in households’ preferences or risk perceptions capitalize in property values, how price dynamics in the housing market affect spatial demographics in hazard-prone urban areas, how structural non-marginal shifts in land markets emerge from the bottom up, and how economic land use systems react to climate change. RHEA allows direct modelling of interactions of many heterogeneous agents in a land market over a heterogeneous spatial landscape. As other ABMs of markets it helps to understand how aggregated patterns and economic indices result from many individual interactions of economic agents.
The model could be used by scientists to explore the impact of climate change and increased flood risk on urban resilience, and the effect of various behavioural assumptions on the choices that people make in response to flood risk. It can be used by policy-makers to explore the aggregated impact of climate adaptation policies aimed at minimizing flood damages and the social costs of flood risk.
Spatiotemporal Visualization of Emotional and Emotional-related Mental States
Luis Macedo | Published Monday, November 07, 2011 | Last modified Saturday, April 27, 2013A system that receives from an agent-based social simulation the agent’s emotional data, their emotional-related data such as motivations and beliefs, as well as their location, and visualizes of all this information in a two dimensional map of the geographic region the agents inhabit as well as on graphs along the time dimension.
Homing pigeon model
Gudrun Wallentin | Published Saturday, October 29, 2016This model represents the flight paths of a flock of homing pigeons according to their flocking-, orientation- and leadership behaviour.
Network formation on a two-layer multiplex with shocks
Paul Smaldino | Published Monday, November 27, 2017A dynamic model of social network formation on single-layer and multiplex networks with structural incentives that vary over time.
Displaying 10 of 875 results for "P Van Geert" clear search


