About the CoMSES Model Library more info
Our mission is to help computational modelers at all levels engage in the establishment and adoption of community standards and good practices for developing and sharing computational models. Model authors can freely publish their model source code in the Computational Model Library alongside narrative documentation, open science metadata, and other emerging open science norms that facilitate software citation, reproducibility, interoperability, and reuse. Model authors can also request peer review of their computational models to receive a DOI.
All users of models published in the library must cite model authors when they use and benefit from their code.
Please check out our model publishing tutorial and contact us if you have any questions or concerns about publishing your model(s) in the Computational Model Library.
We also maintain a curated database of over 7500 publications of agent-based and individual based models with additional detailed metadata on availability of code and bibliometric information on the landscape of ABM/IBM publications that we welcome you to explore.
Displaying 10 of 101 results for "Martijn de Vries" clear search
MarPEM: An Agent Based Model to Explore the Effects of Policy Instruments on the Transition of the Maritime Fuel System
G Bas K De Boo Am Vaes - Van De Hulsbeek I Nikolic | Published Thursday, June 15, 2017MarPEM is an agent-based model that can be used to study the effects of policy instruments on the transition away from HFO.
Mobility USA (MUSA)
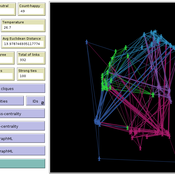
Davide Natalini Giangiacomo Bravo | Published Sunday, December 08, 2013 | Last modified Monday, December 30, 2013MUSA is an ABM that simulates the commuting sector in USA. A multilevel validation was implemented. Social network with a social-circle structure included. Two types of policies have been tested: market-based and preference-change.
Cellular automata model of social networks
Rubens de Almeida Zimbres | Published Tuesday, August 02, 2022This project was developed during the Santa Fe course Introduction to Agent-Based Modeling 2022. The origin is a Cellular Automata (CA) model to simulate human interactions that happen in the real world, from Rubens and Oliveira (2009). These authors used a market research with real people in two different times: one at time zero and the second at time zero plus 4 months (longitudinal market research). They developed an agent-based model whose initial condition was inherited from the results of the first market research response values and evolve it to simulate human interactions with Agent-Based Modeling that led to the values of the second market research, without explicitly imposing rules. Then, compared results of the model with the second market research. The model reached 73.80% accuracy.
In the same way, this project is an Exploratory ABM project that models individuals in a closed society whose behavior depends upon the result of interaction with two neighbors within a radius of interaction, one on the relative “right” and other one on the relative “left”. According to the states (colors) of neighbors, a given cellular automata rule is applied, according to the value set in Chooser. Five states were used here and are defined as levels of quality perception, where red (states 0 and 1) means unhappy, state 3 is neutral and green (states 3 and 4) means happy.
There is also a message passing algorithm in the social network, to analyze the flow and spread of information among nodes. Both the cellular automaton and the message passing algorithms were developed using the Python extension. The model also uses extensions csv and arduino.
Shellmound Mobility
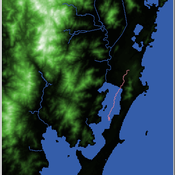
Henrique de Sena Kozlowski | Published Saturday, June 15, 2024Least Cost Path (LCP) analysis is a recurrent theme in spatial archaeology. Based on a cost of movement image, the user can interpret how difficult it is to travel around in a landscape. This kind of analysis frequently uses GIS tools to assess different landscapes. This model incorporates some aspects of the LCP analysis based on GIS with the capabilities of agent-based modeling, such as the possibility to simulate random behavior when moving. In this model the agent will travel around the coastal landscape of Southern Brazil, assessing its path based on the different cost of travel through the patches. The agents represent shellmound builders (sambaquieiros), who will travel mainly through the use of canoes around the lagoons.
How it works?
When the simulation starts the hiker agent moves around the world, a representation of the lagoon landscape of the Santa Catarina state in Southern Brazil. The agent movement is based on the travel cost of each patch. This travel cost is taken from a cost surface raster created in ArcMap to represent the different cost of movement around the landscape. Each tick the agent will have a chance to select the best possible patch to move in its Field of View (FOV) that will take it towards its target destination. If it doesn’t select the best possible patch, it will randomly choose one of the patches to move in its FOV. The simulation stops when the hiker agent reaches the target destination. The elevation raster file and the cost surface map are based on a 1 Arc-second (30m) resolution SRTM image, scaled down 5 times. Each patch represents a square of 150m, with an area of 0,0225km². The dataset uses a UTM Sirgas 2000 22S projection system. There are four different cost functions available to use. They change the cost surface used by the hikers to navigate around the world.
Shellmound Trade
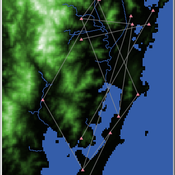
Henrique de Sena Kozlowski | Published Saturday, June 15, 2024This model simulates different trade dynamics in shellmound (sambaqui) builder communities in coastal Southern Brazil. It features two simulation scenarios, one in which every site is the same and another one testing different rates of cooperation. The purpose of the model is to analyze the networks created by the trade dynamics and explore the different ways in which sambaqui communities were articulated in the past.
How it Works?
There are a few rules operating in this model. In either mode of simulation, each tick the agents will produce an amount of resources based on the suitability of the patches inside their occupation-radius, after that the procedures depend on the trade dynamic selected. For BRN? the agents will then repay their owed resources, update their reputation value and then trade again if they need to. For GRN? the agents will just trade with a connected agent if they need to. After that the agents will then consume a random amount of resources that they own and based on that they will grow (split) into a new site or be removed from the simulation. The simulation runs for 1000 ticks. Each patch correspond to a 300x300m square of land in the southern coast of Santa Catarina State in Brazil. Each agent represents a shellmound (sambaqui) builder community. The data for the world were made from a SRTM raster image (1 arc-second) in ArcMap. The sites can be exported into a shapefile (.shp) vector to display in ArcMap. It uses a UTM Sirgas 2000 22S projection system.
An Agent-Based Model of Insurance Customer Behaviour with Word of Mouth Network in C#
Rei England Iqbal Owadally Douglas Wright | Published Friday, March 04, 2022This is an agent-based model with two types of agents: customers and insurers. Insurers are price-takers who choose how much to spend on their service quality, and customers evaluate insurers based on premium, brand preference, and their perceived service quality. Customers are also connected in a small-world network and may share their opinions with their network.
The ABM contains two types of agents: insurers and customers. These act within the environment of a motor insurance market. At each simulation, the model undergoes the following steps:
- Network generation: At the start of the simulation, the model generates a small world network of social links between the customers, and randomly assigns each customer to an initial insurer ...
Viability analysis of a population submitted to floods
Sophie Martin | Published Wednesday, September 22, 2021This model computes the guaranteed viability kernel of a model describing the evolution of a population submitted to successive floods.
The population is described by its wealth and its adaptation rate to floods, the control are information campaigns that have a cost but increase the adaptation rate and the expected successive floods belong to given set defined by the maximal high and the minimal time between two floods.
Two agent-based models of cooperation in dynamic groups and fixed social networks
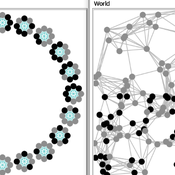
Carlos A. de Matos Fernandes | Published Thursday, January 20, 2022Both models simulate n-person prisoner dilemma in groups (left figure) where agents decide to C/D – using a stochastic threshold algorithm with reinforcement learning components. We model fixed (single group ABM) and dynamic groups (bad-barrels ABM). The purpose of the bad-barrels model is to assess the impact of information during meritocratic matching. In the bad-barrels model, we incorporated a multidimensional structure in which agents are also embedded in a social network (2-person PD). We modeled a random and homophilous network via a random spatial graph algorithm (right figure).
A consumer-demand simulation for Smart Metering tariffs (Innovation Diffusion)
Martin Rixin | Published Thursday, August 18, 2011 | Last modified Saturday, April 27, 2013An Agent-based model simulates consumer demand for Smart Metering tariffs. It utilizes the Bass Diffusion Model and Rogers´s adopter categories. Integration of empirical census microdata enables a validated socio-economic background for each consumer.
(Policy induced) Diffusion of Innovations - An integrated demand-supply Model based on Cournot Competition
Martin Rixin | Published Monday, August 29, 2011 | Last modified Saturday, April 27, 2013Objective is to simulate policy interventions in an integrated demand-supply model. The underlying demand function links both sides. Diffusion proceeds if interactions distribute awareness (Epidemic effect) and rivalry reduces the market price (Probit effect). Endogeneity is given due to the fact that consumer awareness as well as their willingness-to-pay drives supply-side rivalry. Firm´s entry and exit decisions as well as quantity and price settings are driven by Cournot competition.
Displaying 10 of 101 results for "Martijn de Vries" clear search


