About the CoMSES Model Library more info
Our mission is to help computational modelers develop, document, and share their computational models in accordance with community standards and good open science and software engineering practices. Model authors can publish their model source code in the Computational Model Library with narrative documentation as well as metadata that supports open science and emerging norms that facilitate software citation, computational reproducibility / frictionless reuse, and interoperability. Model authors can also request private peer review of their computational models. Models that pass peer review receive a DOI once published.
All users of models published in the library must cite model authors when they use and benefit from their code.
Please check out our model publishing tutorial and feel free to contact us if you have any questions or concerns about publishing your model(s) in the Computational Model Library.
We also maintain a curated database of over 7500 publications of agent-based and individual based models with detailed metadata on availability of code and bibliometric information on the landscape of ABM/IBM publications that we welcome you to explore.
Displaying 10 of 360 results for "Emmanuel Mhike Hove" clear search
Replication of ECEC model: Environmental Feedback and the Evolution of Cooperation
Pierre Bommel | Published Tuesday, April 05, 2011 | Last modified Saturday, April 27, 2013The model, presented here, is a re-implementation of the Pepper and Smuts’ model : - Pepper, J.W. and B.B. Smuts. 2000. “The evolution of cooperation in an ecological context: an agent-based model”. Pp. 45-76 in T.A. Kohler and G.J. Gumerman, eds. Dynamics of human and primate societies: agent-based modeling of social and spatial processes. Oxford University Press, Oxford. - Pepper, J.W. and B.B. Smuts. 2002. “Assortment through Environmental Feedback”. American Naturalist, 160: 205-213 […]
Peer reviewed Monogamous Reproduction in Small Populations and the Enforcement of the Incest Taboo
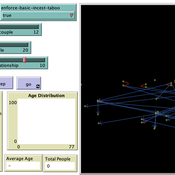
Ian Stuart | Published Wednesday, January 18, 2023This program was developed to simulate monogamous reproduction in small populations (and the enforcement of the incest taboo).
Every tick is a year. Adults can look for a mate and enter a relationship. Adult females in a Relationship (under the age of 52) have a chance to become pregnant. Everyone becomes not alive at 77 (at which point people are instead displayed as flowers).
User can select a starting-population. The starting population will be adults between the ages of 18 and 42.
…
00b SimEvo_V5.08 NetLogo
Garvin Boyle | Published Saturday, October 05, 2019In 1985 Dr Michael Palmiter, a high school teacher, first built a very innovative agent-based model called “Simulated Evolution” which he used for teaching the dynamics of evolution. In his model, students can see the visual effects of evolution as it proceeds right in front of their eyes. Using his schema, small linear changes in the agent’s genotype have an exponential effect on the agent’s phenotype. Natural selection therefore happens quickly and effectively. I have used his approach to managing the evolution of competing agents in a variety of models that I have used to study the fundamental dynamics of sustainable economic systems. For example, here is a brief list of some of my models that use “Palmiter Genes”:
- ModEco - Palmiter genes are used to encode negotiation strategies for setting prices;
- PSoup - Palmiter genes are used to control both motion and metabolic evolution;
- TpLab - Palmiter genes are used to study the evolution of belief systems;
- EffLab - Palmiter genes are used to study Jevon’s Paradox, EROI and other things.
…
RETURN MIGRATION AFTER BRAIN DRAIN: A SIMULATION APPROACH
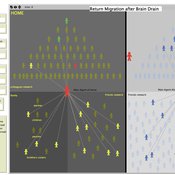
Alessandro Pluchino Alessio Emanuele Biondo Andrea Rapisarda | Published Friday, June 21, 2013This model, realized on the NetLogo platform, compares utility levels at home and abroad to simulate agents’ migration and their eventual return. Our model is based on two fundamental individual features, i.e. risk aversion and initial expectation, which characterize the dynamics of different agents according to the evolution of their social contacts.
Talent vs Luck: the role of randomness in success and failure
Alessandro Pluchino Alessio Emanuele Biondo Andrea Rapisarda | Published Monday, July 16, 2018The largely dominant meritocratic paradigm of highly competitive Western cultures is rooted on the belief that success is due mainly, if not exclusively, to personal qualities such as talent, intelligence, skills, smartness, efforts, willfulness, hard work or risk taking. Sometimes, we are willing to admit that a certain degree of luck could also play a role in achieving significant material success. But, as a matter of fact, it is rather common to underestimate the importance of external forces in individual successful stories. It is very well known that intelligence (or, more in general, talent and personal qualities) exhibits a Gaussian distribution among the population, whereas the distribution of wealth - often considered a proxy of success - follows typically a power law (Pareto law), with a large majority of poor people and a very small number of billionaires. Such a discrepancy between a Normal distribution of inputs, with a typical scale (the average talent or intelligence), and the scale invariant distribution of outputs, suggests that some hidden ingredient is at work behind the scenes. In a recent paper, with the help of this very simple agent-based model realized with NetLogo, we suggest that such an ingredient is just randomness. In particular, we show that, if it is true that some degree of talent is necessary to be successful in life, almost never the most talented people reach the highest peaks of success, being overtaken by mediocre but sensibly luckier individuals. As to our knowledge, this counterintuitive result - although implicitly suggested between the lines in a vast literature - is quantified here for the first time. It sheds new light on the effectiveness of assessing merit on the basis of the reached level of success and underlines the risks of distributing excessive honors or resources to people who, at the end of the day, could have been simply luckier than others. With the help of this model, several policy hypotheses are also addressed and compared to show the most efficient strategies for public funding of research in order to improve meritocracy, diversity and innovation.
Peer reviewed Lithic Raw Material Procurement and Provisioning
Jonathan Paige | Published Friday, March 06, 2015 | Last modified Thursday, March 12, 2015This model simulates the lithic raw material use and provisioning behavior of a group that inhabits a permanent base camp, and uses stone tools.
Modeling Asian-Papuan Admixture during the Neolithic Expansion across Island Southeast Asia
Murray Cox François Vallée | Published Friday, December 09, 2016This Repast Simphony model simulates genomic admixture during the farming expansion of human groups from mainland Asia into the Papuan dominated islands of Southeast Asia during the Neolithic period.
DITCH --- A Model of Inter-Ethnic Partnership Formation
Ruth Meyer Laurence Lessard-Phillips Huw Vasey | Published Wednesday, November 05, 2014 | Last modified Tuesday, February 02, 2016The DITCH model has been developed to investigate partner selection processes, focusing on individual preferences, opportunities for contact, and group size to uncover how these may lead to differential rates of inter-ethnic marriage.
Wildlife-Human Interactions in Shared Landscapes (WHISL)
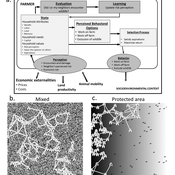
Nicholas Magliocca Neil Carter Andres Baeza-Castro | Published Friday, May 22, 2020This model simulates a group of farmers that have encounters with individuals of a wildlife population. Each farmer owns a set of cells that represent their farm. Each farmer must decide what cells inside their farm will be used to produce an agricultural good that is self in an external market at a given price. The farmer must decide to protect the farm from potential encounters with individuals of the wildlife population. This decision in the model is called “fencing”. Each time that a cell is fenced, the chances of a wildlife individual to move to that cell is reduced. Each encounter reduces the productive outcome obtained of the affected cell. Farmers, therefore, can reduce the risk of encounters by exclusion. The decision of excluding wildlife is made considering the perception of risk of encounters. In the model, the perception of risk is subjective, as it depends on past encounters and on the perception of risk from other farmers in the community. The community of farmers passes information about this risk perception through a social network. The user (observer) of the model can control the importance of the social network on the individual perception of risk.
Zombies
Jennifer Badham | Published Tuesday, June 08, 2021Zombies move toward humans and humans move (faster) away from zombies. They fight if they meet, and humans who lose become zombies.
Displaying 10 of 360 results for "Emmanuel Mhike Hove" clear search
