About the CoMSES Model Library more info
Our mission is to help computational modelers at all levels engage in the establishment and adoption of community standards and good practices for developing and sharing computational models. Model authors can freely publish their model source code in the Computational Model Library alongside narrative documentation, open science metadata, and other emerging open science norms that facilitate software citation, reproducibility, interoperability, and reuse. Model authors can also request peer review of their computational models to receive a DOI.
All users of models published in the library must cite model authors when they use and benefit from their code.
Please check out our model publishing tutorial and contact us if you have any questions or concerns about publishing your model(s) in the Computational Model Library.
We also maintain a curated database of over 7500 publications of agent-based and individual based models with additional detailed metadata on availability of code and bibliometric information on the landscape of ABM/IBM publications that we welcome you to explore.
Displaying 10 of 92 results resources clear search
Shellmound Trade
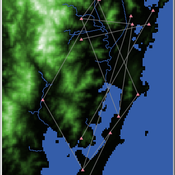
Henrique de Sena Kozlowski | Published Saturday, June 15, 2024This model simulates different trade dynamics in shellmound (sambaqui) builder communities in coastal Southern Brazil. It features two simulation scenarios, one in which every site is the same and another one testing different rates of cooperation. The purpose of the model is to analyze the networks created by the trade dynamics and explore the different ways in which sambaqui communities were articulated in the past.
How it Works?
There are a few rules operating in this model. In either mode of simulation, each tick the agents will produce an amount of resources based on the suitability of the patches inside their occupation-radius, after that the procedures depend on the trade dynamic selected. For BRN? the agents will then repay their owed resources, update their reputation value and then trade again if they need to. For GRN? the agents will just trade with a connected agent if they need to. After that the agents will then consume a random amount of resources that they own and based on that they will grow (split) into a new site or be removed from the simulation. The simulation runs for 1000 ticks. Each patch correspond to a 300x300m square of land in the southern coast of Santa Catarina State in Brazil. Each agent represents a shellmound (sambaqui) builder community. The data for the world were made from a SRTM raster image (1 arc-second) in ArcMap. The sites can be exported into a shapefile (.shp) vector to display in ArcMap. It uses a UTM Sirgas 2000 22S projection system.
An Agent-Based Model to Assess Possible Interventions for Large Shigellosis Outbreaks
Erez Hatna Jeewoen Shin Sharon Greene | Published Wednesday, June 12, 2024Large outbreaks of Shigella sonnei among children in Haredi Jewish (ultra-Orthodox) communities in Brooklyn, New York have occurred every 3–5 years since at least the mid-1980s. These outbreaks are partially attributable to large numbers of young children in these communities, with transmission highest in child care and school settings, and secondary transmission within households. As these outbreaks have been prolonged and difficult to control, we developed an agent-based model of shigellosis transmission among children in these communities to support New York City Department of Health and Mental Hygiene staff. Simulated children were assigned an initial susceptible, infectious, or recovered (immune) status and interacted and moved between their home, child care program or school, and a community site. We calibrated the model according to observed case counts as reported to the Health Department. Our goal was to better understand the efficacy of existing interventions and whether limited outreach resources could be focused more effectively.
GenoScope
Kristin Crouse | Published Wednesday, May 29, 2024Identifying how organisms respond to environmental stressors remains of central importance as human impacts continue to shift the environmental conditions for countless species. Some mammals are able to mitigate these environmental stressors at the cellular level, but the mechanisms by which cells are able to do this and how these strategies vary among species is not well understood. At the cellular level, it is difficult to identify the temporal dynamics of the system through empirical data because fine-grained time course samples are both incomplete and limited by available resources. To help identify the mechanisms by which animal cells mitigate extreme environmental conditions, we propose an agent-based model to capture the dynamics of the system. In the model, agents are regulatory elements and genes, and are able to impact the behaviors of each other. Rather than imposing rules for these interactions among agents, we will begin with randomized sets of rules and calibrate the model based on empirical data of cellular responses to stress. We will apply a common-garden framework to cultured cells from 16 mammalian species, which will yield genomic data and measures of cell morphology and physiology when exposed to different levels of temperature, glucose, and oxygen. These species include humans, dolphins, bats, and camels, among others, which vary in how they respond to environmental stressors, offering a comparative approach for identifying mechanistic rules whereby cells achieve robustness to environmental stressors. For calibration of the model, we will iteratively select for rules that best lead to the emergent outcomes observed in the cellular assays. Our model is generalized for any species, any cell type, and any environmental stressor, offering many applications of the model beyond our study. This study will increase our understanding of how organisms mitigate environmental stressors at the cellular level such that we can better address how organisms are impacted by and respond to extreme environmental conditions.
Evaluate government policies for farmers’ adoption and synergy in improving irrigation systems
Amir Hajimirzajan | Published Sunday, February 25, 2024The ABM model is designed to model the adaptability of farmers in DTIM. This model includes two groups of farmers and local government admins agents. Farmers with different levels, with low WP of DTIM, are looking for economic benefits and reduced irrigation and production costs. Meanwhile, the government is looking for strategic goals to maintain water resources’ sustainability. The local government admins employ incentives (subsidies in this study) to encourage farmers to DTIM. In addition, it is used as a tool for supervision and training farmers’ performance. Farmers are currently harvesting water resources with irrigation systems and different levels of technology, and they intend to provide short-term benefits. Farmers adjust the existing approach based on their knowledge of the importance of DTIM and propensity to increase WP and cost-benefit evaluation. DTIM has an initial implementation fee. Every farmer can increase WP by using government subsidies. If none of the farmers create optimal use of water resources, access to water resources will be threatened in the long term. This is considered a hypothetical cost for farmers who do not participate in DTIM. With DTIM, considering that local government admins’ facilities cover an essential part of implementation costs, farmers may think of profiting from local government admins’ facilities by selling that equipment, especially if the farmers in the following conditions may consider selling their developed irrigation equipment. In this case, the technology of their irrigation system will return to the state before development.
- When the threshold of farmers’ propensity to DTIM is low (for example, in the conditions of scarcity of access to sufficient training about the new irrigation system or its role in reducing the cost and sustainability of water resources)
- When the share of government subsidy is high, and as a result, the profit from the sale of equipment is attractive, especially in conditions of inflation.
- Finally, farmers’ honesty threshold should be reduced based on the positive experience of profit-seeking and deception among neighbors.
Increasing the share of government subsidies can encourage farmers to earn profits. Therefore, the government can help increase farmers’ profits by considering the assessment teams at different levels with DTIM training . local government admins evaluations monitor the behavior of farmers. If farmers sell their improved irrigation system for profit, they may be deprived of some local government admins’ services and the possibility of receiving subsidies again. Assessments The local government admins can increase farmers’ honesty. Next, the ABM model evaluates local government admins policies to achieve a suitable framework for water resources management in the Miandoab region.
Animal territory formation (Reusable Building Block RBB)
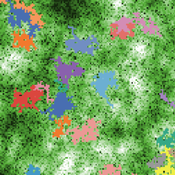
Robert Zakrzewski Stephanie Kramer-Schadt Volker Grimm | Published Sunday, November 12, 2023This is a generic sub-model of animal territory formation. It is meant to be a reusable building block, but not in the plug-and-play sense, as amendments are likely to be needed depending on the species and region. The sub-model comprises a grid of cells, reprenting the landscape. Each cell has a “quality” value, which quantifies the amount of resources provided for a territory owner, for example a tiger. “Quality” could be prey density, shelter, or just space. Animals are located randomly in the landscape and add grid cells to their intial cell until the sum of the quality of all their cells meets their needs. If a potential new cell to be added is owned by another animal, competition takes place. The quality values are static, and the model does not include demography, i.e. mortality, mating, reproduction. Also, movement within a territory is not represented.
Design principles for a redistributive collective action institution in times of crisis
Aashis Joshi | Published Friday, September 15, 2023What policy measures are effective in redistributing essential resources during crisis situations such as climate change impacts? We model a collective action institution with different rules for designing and organizing it, and make our analysis specific to various societal contexts.
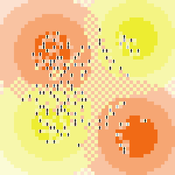
Our model captures a generic societal context of unequal vulnerability and climate change impact in a stylized form. We represent a community of people who harvest and consume an essential resource to maintain their well-being. However, their ability to harvest the resource is not equal; people are characterized by a ‘resource access’ attribute whose values are uniformly distributed from 0 to 1 in the population. A person’s resource access value determines the amount of resource units they are able to harvest, and therefore the welfare levels they are able to attain. People travel to the centralized resource region and derive well-being or welfare, represented as an energy gain, by harvesting and consuming resource units.
The community is subject to a climate change impact event that occurs with a certain periodicity and over a certain duration. The capacity of resource units to regenerate diminishes during the impact events. Unequal capacities to access the essential resource results in unequal vulnerability among people with regards to their ability to maintain a sufficient welfare level, especially during impact events.
…
SugarscapeCW
Christopher Watts | Published Saturday, August 01, 2015 | Last modified Wednesday, April 12, 2023A replication in Netlogo 5.2 of the classic model, Sugarscape (Epstein & Axtell, 1996).
The S-uFUNK Model
Davide Secchi | Published Friday, March 17, 2023This version 2.1.0 of the uFunk model is about setting a business strategy (the S in the name) for an organization. A team of managers (or executives) meet and discuss various options on the strategy for the firm. There are three aspects that they have to agree on to set the strategic positioning of the organization.
The discussion is on market, stakeholders, and resources. The team (it could be a business strategy task force) considers various aspects of these three elements. The resources they use to develop the discussion can come from a traditional approach to strategy or from non-traditional means (e.g., so-called serious play, creativity and imagination techniques).
The S-uFunk 2.1.0 Model wants to understand to which extent cognitive means triggered by traditional and non-traditional resources affect the making of the strategy process.
Netlogo Earned Value Management Model
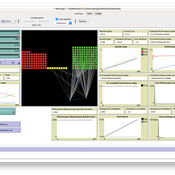
Manuel Castañón-Puga Ricardo Fernando Rosales–Cisneros Julio César Acosta–Prado Alfredo Tirado–Ramos Camilo Khatchikian Elías Aburto–Camacllanqui | Published Thursday, November 24, 2022The model aims to illustrate how Earned Value Management (EVM) provides an approach to measure a project’s performance by comparing its actual progress against the planned one, allowing it to evaluate trends to formulate forecasts. The instance performs a project execution and calculates the EVM performance indexes according to a Performance Measurement Baseline (PMB), which integrates the description of the work to do (scope), the deadlines for its execution (schedule), and the calculation of its costs and the resources required for its implementation (cost).
Specifically, we are addressing the following questions: How does the risk of execution delay or advance impact cost and schedule performance? How do the players’ number or individual work capacity impact cost and schedule estimations to finish? Regardless of why workers cause delays or produce overruns in their assignments, does EVM assess delivery performance and help make objective decisions?
To consider our model realistic enough for its purpose, we use the following patterns: The model addresses classic problems of Project Management (PM). It plays the typical task board where workers are assigned to complete a task backlog in project performance. Workers could delay or advance in the task execution, and we calculate the performance using the PMI-recommended Earned Value.
WATER REUSE ADOPTION BY FARMERS (WRAF)
Farshid Shoushtarian | Published Tuesday, September 27, 2022Agriculture is the largest water-consuming sector worldwide, responsible for almost 70% of the world’s total freshwater consumption. Agricultural water reuse is one of the most sustainable and reliable methods to alleviate water shortages worldwide. However, the dynamics of agricultural water reuse adoption by farmers and its impacts on local water resources are still unknown to the scientific community, according to the literature. Therefore, the primary purpose of the WRAF model is to investigate the micro-level dynamics of agricultural water reuse adoption by farmers and its impacts on local water resources. The WRAF was developed using agent-based modeling as an exploratory tool for scenario analysis. The model was specifically designed for researchers and water resources decision-makers, especially those interested in natural resources management and water reuse.
WRAF simulates a virtual agricultural area in which several autonomous farms operate. It also simulates these farms’ water consumption dynamics. The developed model includes two types of agents: farmers and wastewater treatment plants. In general, farmer agents are the main water-consuming agents, and wastewater treatment plant agents are recycled water providers in the WRAF model. Dynamic simulation of agricultural water supply and demand in the area allows the user to observe the results of various irrigation water management scenarios, including recycled water. The models also enable the user to apply multiple climate change scenarios, including normal, moderate drought, severe drought, and wet weather conditions.
Displaying 10 of 92 results resources clear search


