About the CoMSES Model Library more info
Our mission is to help computational modelers at all levels engage in the establishment and adoption of community standards and good practices for developing and sharing computational models. Model authors can freely publish their model source code in the Computational Model Library alongside narrative documentation, open science metadata, and other emerging open science norms that facilitate software citation, reproducibility, interoperability, and reuse. Model authors can also request peer review of their computational models to receive a DOI.
All users of models published in the library must cite model authors when they use and benefit from their code.
Please check out our model publishing tutorial and contact us if you have any questions or concerns about publishing your model(s) in the Computational Model Library.
We also maintain a curated database of over 7500 publications of agent-based and individual based models with additional detailed metadata on availability of code and bibliometric information on the landscape of ABM/IBM publications that we welcome you to explore.
Displaying 10 of 771 results for "Jon Solera" clear search
Social identity approach in a data-driven Axelrod model
alejandrodinkelberg | Published Thursday, July 28, 2022Simulations based on the Axelrod model and extensions to inspect the volatility of the features over time (AXELROD MODEL & Agreement threshold & two model variations based on the Social identity approach)
The Axelrod model is used to predict the number of changes per feature in comparison to the datasets and is used to compare different model variations and their performance.
Input: Real data
…
Agent-based tax evasion model for investigating impacts of public disclosure
Hiroyuki Sano | Published Thursday, March 14, 2024The model explores the impact of public disclosure on tax compliance among diverse agents, including individual taxpayers and a tax authority. It incorporates heterogeneous preferences and income endowments among taxpayers, captured through a utility function that considers psychic costs subtracted from expected pecuniary utility. These costs include moral, reciprocity, and stigma costs associated with norm violations, leading to variations in taxpayers’ risk attitudes and related parameters. The tax authority’s attributes, such as the frequency of random audits, penalty rate, and the choice between partial or full disclosure, remain fixed throughout the simulation. Income endowments and preference parameters are randomly assigned to taxpayers at the outset.
Taxpayers maximize their expected utility by reporting income, taking into account tax, penalty, and audit rates. They make annual decisions based on their own and their peers’ behaviors from the previous year. Taxpayers indirectly interact at the societal level through public disclosure conducted by the tax authority, exchanging tax information among peers. Each period in the simulation collects data on total reported income, average compliance rates per income group, distribution of compliance rates, counts of compliers, full evaders, partial evaders, and the numbers of taxpayers experiencing guilt and anger. The model evaluates whether public disclosure positively or negatively impacts compliance rates and quantifies this impact based on aggregated individual reporting behaviors.
MeReDiem : Fallow Land Simulations to examine the conditions of sustainable village livelihood
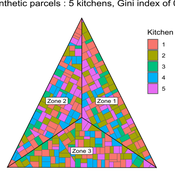
Etienne DELAY Paul Chapron Mathieu | Published Monday, January 20, 2025 | Last modified Tuesday, January 21, 2025The MeReDiem model aims to simulate the effect of socio-agricultural practices of farmers and pastors on the food sustainability and soil fertility of a serrer village, in Senegal. The model is a central part of a companion modeling and exploration approach, described in a paper, currently under review)
The village population is composed of families (kitchens). Kitchens cultivate their land parcels to feed their members, aiming for food security at the family level. On a global level , the village tries to preserve the community fallow land as long as possible.
Kitchens sizes vary depending on the kitchens food production, births and migration when food is insufficient.
…
SLUCEII LUXE (Land Use in an eXurban Environment)
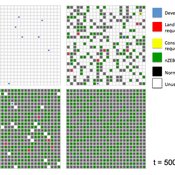
Qingxu Huang Rick L Riolo Shipeng Sun Derek Robinson Dawn Parker Tatiana Filatova Meghan Hutchins Dan Brown | Published Tuesday, September 10, 2013 | Last modified Saturday, October 22, 2022LUXE is a land-use change model featuring different levels of land market implementation. It integrates utility measures, budget constraints, competitive bidding, and market interactions to model land-use change in exurban environment.
Survival analysis and Population viability analysis of the Northern Bald Ibis
Stephanie Kramer-Schadt Cédric Scherer Viktoriia Radchuk Sinah Drenske Corinna Esterer Ingo Kowarik Johannes Fritz | Published Thursday, August 04, 2022This is the full repository to run the survival analysis (in R) and run the population viability model and its analysis (NetLogo + R) of the Northern Bald Ibis (NBI) presented in the study
On the road to self-sustainability: Reintroduced migratory European Northern Bald Ibises (Geronticus eremita) still need management interventions for population viability
by Sinah Drenske, Viktoriia Radchuk, Cédric Scherer, Corinna Esterer, Ingo Kowarik, Johannes Fritz, Stephanie Kramer-Schadt
…
Exploring Transitions towards Sustainable Construction
Jesus Rosales-Carreon César García-Díaz | Published Wednesday, October 30, 2013 | Last modified Saturday, January 31, 2015This model illustrates actor interaction in the construction sector, according to information gathered in NL. It offers a simple frame to represent diverse interests, interdependencies and effects on the number of built sustainable houses.
Peer reviewed PPHPC - Predator-Prey for High-Performance Computing
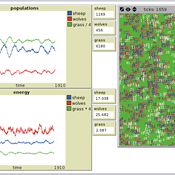
Nuno Fachada | Published Saturday, August 08, 2015 | Last modified Wednesday, November 25, 2015PPHPC is a conceptual model for studying and evaluating implementation strategies for spatial agent-based models (SABMs). It is a realization of a predator-prey dynamic system, and captures important SABMs characteristics.
PalaeoDiet : Rabbit hunting during the Upper Palaeolithic
Liliana Perez Samuel Seuru Ariane Burke | Published Thursday, October 06, 2022Zooarchaeological evidences indicate that rabbit hunting became prevalent during the Upper Palaeolithic in the Iberian Peninsula.
The purpose of the ABM is to test if warren hunting using nets as a collective strategy can explain the introduction of rabbits in the human diet in the Iberian Peninsula during this period. It is analyzed whether this hunting strategy has an impact on human diet breadth by affecting the relative abundance of other main taxa in the dietary spectrum.
Model validity is measured by comparing simulated diet breadth to the observed diet breadth in the zooarchaeological record.
The agent-based model is explicitly grounded on the Diet Breadth Model (DBM), from the Optimal Foraging Theory (OFT).
…
Role of Diversity in Team Performance: the Case of Missing Expertise, an Agent Based Simulations
Tamás Kiss | Published Friday, December 29, 2023This ABM simulates problem solving agents as they work on a set of tasks. Each agent has a trait vector describing their skills. Two agents might form a collaboration if their traits are similar enough. Tasks are defined by a component vector. Agents work on tasks by decreasing tasks’ component vectors towards zero.
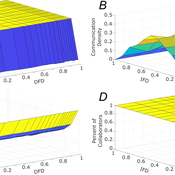
The simulation generates agents with given intrapersonal functional diversity (IFD), and dominant function diversity (DFD), and a set of random tasks and evaluates how agents’ traits influence their level of communication and the performance of a team of agents.
Modeling results highlight the importance of the distributions of agents’ properties forming a team, and suggests that for a thorough description of management teams, not only diversity measures based on individual agents, but an aggregate measure is also required.
…
Human Resource Management Parameter Experimentation Tool
Carmen Iasiello | Published Thursday, May 07, 2020 | Last modified Thursday, February 25, 2021The agent based model presented here is an explicit instantiation of the Two-Factor Theory (Herzberg et al., 1959) of worker satisfaction and dissatisfaction. By utilizing agent-based modeling, it allows users to test the empirically found variations on the Two-Factor Theory to test its application to specific industries or organizations.
Iasiello, C., Crooks, A.T. and Wittman, S. (2020), The Human Resource Management Parameter Experimentation Tool, 2020 International Conference on Social Computing, Behavioral-Cultural Modeling & Prediction and Behavior Representation in Modeling and Simulation, Washington DC.
Displaying 10 of 771 results for "Jon Solera" clear search
