Our mission is to help computational modelers develop, document, and share their computational models in accordance with community standards and good open science and software engineering practices. Model authors can publish their model source code in the Computational Model Library with narrative documentation as well as metadata that supports open science and emerging norms that facilitate software citation, computational reproducibility / frictionless reuse, and interoperability. Model authors can also request private peer review of their computational models. Models that pass peer review receive a DOI once published.
All users of models published in the library must cite model authors when they use and benefit from their code.
Please check out our model publishing tutorial and feel free to contact us if you have any questions or concerns about publishing your model(s) in the Computational Model Library.
Displaying 10 of 504 results for "Tim M Daw" clear search
User Guide and Templates for RAT-RS (a reporting standard for improving the documentation of data use in agent-based modelling)
Melania Borit Edmund Chattoe-Brown Peer-Olaf Siebers Sebastian Achter | Published Saturday, March 12, 2022The Rigor and Transparency Reporting Standard (RAT-RS) is a tool to improve the documentation of data use in Agent-Based Modelling. Following the development of reporting standards for models themselves, attention to empirical models has now reached a stage where these standards need to take equally effective account of data use (which until now has tended to be an afterthought to model description). It is particularly important that a standard should allow the reporting of the different uses to which data may be put (specification, calibration and validation), but also that it should be compatible with the integration of different kinds of data (for example statistical, qualitative, ethnographic and experimental) sometimes known as mixed methods research.
For the full details on the RAT-RS, please refer to the related publication “RAT-RS: A Reporting Standard for Improving the Documentation of Data Use in Agent-Based Modelling” (http://dx.doi.org/10.1080/13645579.2022.2049511).
Here we provide supplementary material for this article, consisting of a RAT-RS user guide and RAT-RS templates.
Space colonization
allagonne | Published Wednesday, January 05, 2022Agent-Based-Modeling - space colonization
ask me for the .nlogo model
WHAT IS IT?
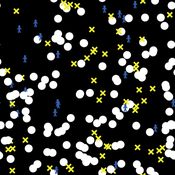
The goal of this project is to simulate with NetLogo (v6.2) a space colonization of humans, starting from Earth, into the Milky Way.
HOW IT WORKS
…
Mobility, Resource Harvesting and Robustness of Social-Ecological Systems
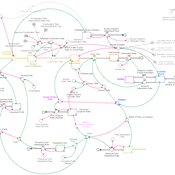
Irene Perez Ibarra | Published Monday, September 24, 2012 | Last modified Saturday, April 27, 2013The model is a stylized representation of a social-ecological system of agents moving and harvesting a renewable resource. The purpose is to analyze how mobility affects sustainability. Experiments changing agents’ mobility, landscape and information governments have can be run.
PopComp
Andre Costopoulos | Published Thursday, December 10, 2020PopComp by Andre Costopoulos 2020
[email protected]
Licence: DWYWWI (Do whatever you want with it)
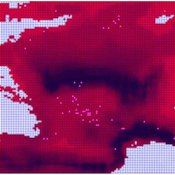
I use Netlogo to build a simple environmental change and population expansion and diffusion model. Patches have a carrying capacity and can host two kinds of populations (APop and BPop). Each time step, the carrying capacity of each patch has a given probability of increasing or decreasing up to a maximum proportion.
…
HomininSpace
Fulco Scherjon | Published Friday, November 25, 2016 | Last modified Tuesday, October 06, 2020A modelling system to simulate Neanderthal demography and distribution in a reconstructed Western Europe for the late Middle Paleolithic.
ABM Simulation of Transition from Late Longshan Cultures to Early Erlitou Culture
Carmen Iasiello | Published Sunday, November 26, 2023Within the archeological record for Bronze Age Chinese culture, there continues to be a gap in our understanding of the sudden rise of the Erlitou State from the previous late Longshan chiefdoms. In order to examine this period, I developed and used an agent-based model (ABM) to explore possible socio-politically relevant hypotheses for the gap between the demise of the late Longshan cultures and rise of the first state level society in East Asia. I tested land use strategy making and collective action in response to drought and flooding scenarios, the two plausible environmental hazards at that time. The model results show cases of emergent behavior where an increase in social complexity could have been experienced if a catastrophic event occurred while the population was sufficiently prepared for a different catastrophe, suggesting a plausible lead for future research into determining the life of the time period.
The ABM published here was originally developed in 2016 and its results published in the Proceedings of the 2017 Winter Simulation Conference.
Endogenous Dynamics of Housing Market Cycles
Onur Özgün Birnur Özbaş Yaman Barlas | Published Monday, September 09, 2013 | Last modified Wednesday, January 08, 2014The purpose of this model is to analyze the dynamics of endogenously created oscillations in housing prices using a system dynamics simulation model, built from the perspective of construction companies.
Modeling information Asymmetries in Tourism
Jacopo A. Baggio Rodolfo Baggio | Published Monday, January 09, 2012 | Last modified Saturday, April 27, 2013A very simple model elaborated to explore what may happens when buyers (travelers) have more information than sellers (tourist destinations)
Peer reviewed Infectious diseases model for mixed-methods research chapter
Mark Moritz Ian M Hamilton Chelsea E Hunter Daniel C Peart | Published Sunday, January 30, 2022The purpose of this curricular model is to teach students the basics of modeling complex systems using agent-based modeling. It is a simple SIR model that simulates how a disease spreads through a population as its members change from susceptible to infected to recovered and then back to susceptible. The dynamics of the model are such that there are multiple emergent outcomes depending on the parameter settings, initial conditions, and chance.
The curricular model can be used with the chapter Agent-Based Modeling in Mixed Methods Research (Moritz et al. 2022) in the Handbook of Teaching Qualitative & Mixed Methods (Ruth et al. 2022).
The instructional videos can be accessed on YouTube: Video 1 (https://youtu.be/32_JIfBodWs); Video 2 (https://youtu.be/0PK_zVKNcp8); and Video 3 (https://youtu.be/0bT0_mYSAJ8).

Spatial Game Theory
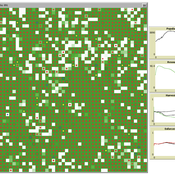
Kristin Crouse | Published Tuesday, November 05, 2019 | Last modified Wednesday, April 22, 2026This model is a spatial evolutionary game theory model in which animals with inherited red or blue phenotypes move, interact locally, gain or lose energy based on payoff structure, and reproduce across generations. Plants provide a stationary green component of the environment. The model can be used to examine how game payoffs, inheritance, and survival shape population and evolutionary dynamics over time.
Displaying 10 of 504 results for "Tim M Daw" clear search