About the CoMSES Model Library more info
Our mission is to help computational modelers at all levels engage in the establishment and adoption of community standards and good practices for developing and sharing computational models. Model authors can freely publish their model source code in the Computational Model Library alongside narrative documentation, open science metadata, and other emerging open science norms that facilitate software citation, reproducibility, interoperability, and reuse. Model authors can also request peer review of their computational models to receive a DOI.
All users of models published in the library must cite model authors when they use and benefit from their code.
Please check out our model publishing tutorial and contact us if you have any questions or concerns about publishing your model(s) in the Computational Model Library.
We also maintain a curated database of over 7500 publications of agent-based and individual based models with additional detailed metadata on availability of code and bibliometric information on the landscape of ABM/IBM publications that we welcome you to explore.
Displaying 10 of 1069 results for "A Flache" clear search
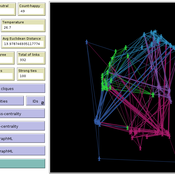
Cellular automata model of social networks
Rubens de Almeida Zimbres | Published Tuesday, August 02, 2022This project was developed during the Santa Fe course Introduction to Agent-Based Modeling 2022. The origin is a Cellular Automata (CA) model to simulate human interactions that happen in the real world, from Rubens and Oliveira (2009). These authors used a market research with real people in two different times: one at time zero and the second at time zero plus 4 months (longitudinal market research). They developed an agent-based model whose initial condition was inherited from the results of the first market research response values and evolve it to simulate human interactions with Agent-Based Modeling that led to the values of the second market research, without explicitly imposing rules. Then, compared results of the model with the second market research. The model reached 73.80% accuracy.
In the same way, this project is an Exploratory ABM project that models individuals in a closed society whose behavior depends upon the result of interaction with two neighbors within a radius of interaction, one on the relative “right” and other one on the relative “left”. According to the states (colors) of neighbors, a given cellular automata rule is applied, according to the value set in Chooser. Five states were used here and are defined as levels of quality perception, where red (states 0 and 1) means unhappy, state 3 is neutral and green (states 3 and 4) means happy.
There is also a message passing algorithm in the social network, to analyze the flow and spread of information among nodes. Both the cellular automaton and the message passing algorithms were developed using the Python extension. The model also uses extensions csv and arduino.
The purpose of this model is to enhance a basic ABM through a simple set of rules identified using the activity-driven models in order to produce more realistic patterns of pedestrian movement.
Cluster Analysis
Lars Spång | Published Sunday, January 14, 2018This model illustrates how to apply a simple cluster-analysis on points distributed around 5 centers. The result can be displayed in shades of a color or a spectacular colored pattern.
Alpine land-use allocation model - ALUAM-AB
Simon Briner | Published Tuesday, January 31, 2012 | Last modified Saturday, April 27, 2013A model for simulating farmers and foresters response on changing climate and changing socio-economic parameters. Modeled are changes in land-use as well as in ecosystem services provision.
Modeling Personal Carbon Trading with ABM
Roman Seidl | Published Friday, December 07, 2018 | Last modified Thursday, July 29, 2021A simulated approach for Personal Carbon Trading, for figuring out what effects it might have if it will be implemented in the real world. We use an artificial population with some empirical data from international literature and basic assumptions about heterogeneous energy demand. The model is not to be used as simulating the actual behavior of real populations, but a toy model to test the effects of differences in various factors such as number of agents, energy price, price of allowances, etc. It is important to adapt the model for specific countries as carbon footprint and energy demand determines the relative success of PCT.
Peer reviewed The Garbage Can Model of Organizational Choice
Guido Fioretti | Published Monday, April 20, 2020 | Last modified Thursday, April 23, 2020The Garbage Can Model of Organizational Choice is a fundamental model of organizational decision-making originally proposed by J.D. Cohen, J.G. March and J.P. Olsen in 1972. In the 2000s, G. Fioretti and A. Lomi presented a NetLogo agent-based interpretation of this model. This code is the NetLogo 6.1.1 updated version of the Fioretti-Lomi model.
MeReDiem : Fallow Land Simulations to examine the conditions of sustainable village livelihood
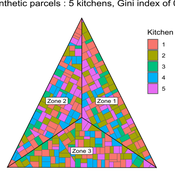
Etienne DELAY Paul Chapron Mathieu | Published Monday, January 20, 2025 | Last modified Tuesday, January 21, 2025The MeReDiem model aims to simulate the effect of socio-agricultural practices of farmers and pastors on the food sustainability and soil fertility of a serrer village, in Senegal. The model is a central part of a companion modeling and exploration approach, described in a paper, currently under review)
The village population is composed of families (kitchens). Kitchens cultivate their land parcels to feed their members, aiming for food security at the family level. On a global level , the village tries to preserve the community fallow land as long as possible.
Kitchens sizes vary depending on the kitchens food production, births and migration when food is insufficient.
…
A simplified Arthur & Polak logic circuit model of combinatory technology build-out via incremental development. Only some inventions trigger radical effects, suggesting they depend on whole interdependent systems rather than specific innovations.
ForagerNet3_Demography_V2
Andrew White | Published Thursday, February 13, 2014ForagerNet3_Demography_V2 is a non-spatial ABM for exploring hunter-gatherer demography. This version (developed from FN3D_V1) contains code for calculating the ratio of old to young adults (the “OY ratio”) in the living and dead populations.
SMASH: Stylized Model of Agricultural Smallholder Households
Tim Williams | Published Tuesday, December 08, 2020The SMASH model is an agent-based model of rural smallholder households. It models households’ evolving income and wealth, which they earn through crop sales. Wealth is carried in the form of livestock, which are grazed on an external rangeland (exogenous) and can be bought/sold as investment/coping mechanisms. The model includes a stylized representation of soil nutrient dynamics, modeling the inflows and outflows of organic and inorganic nitrogen from each household’s field.
The model has been applied to assess the resilience-enhancing effects of two different farm-level adaptation strategies: legume cover cropping and crop insurance. These two strategies interact with the model through different mechanims - legume cover cropping through ecological mechanisms and crop insurance through financial mechanisms. The model can be used to investigate the short- and long-term effects of these strategies, as well as how they may differently benefit different types of household.
Displaying 10 of 1069 results for "A Flache" clear search


