About the CoMSES Model Library more info
Our mission is to help computational modelers at all levels engage in the establishment and adoption of community standards and good practices for developing and sharing computational models. Model authors can freely publish their model source code in the Computational Model Library alongside narrative documentation, open science metadata, and other emerging open science norms that facilitate software citation, reproducibility, interoperability, and reuse. Model authors can also request peer review of their computational models to receive a DOI.
All users of models published in the library must cite model authors when they use and benefit from their code.
Please check out our model publishing tutorial and contact us if you have any questions or concerns about publishing your model(s) in the Computational Model Library.
We also maintain a curated database of over 7500 publications of agent-based and individual based models with additional detailed metadata on availability of code and bibliometric information on the landscape of ABM/IBM publications that we welcome you to explore.
Displaying 10 of 212 results for "Dara Vancea" clear search
Peer reviewed Are Countertrade credits as flexible and efficient as cash? A novel approach to reducing income inequality using countertrade methodology.
Peter Malliaros | Published Monday, May 03, 2021 | Last modified Tuesday, May 11, 2021The impacts of income inequality can be seen everywhere, regardless of the country or the level of economic development. According to the literature review, income inequality has negative impacts in economic, social, and political variables. Notwithstanding of how well or not countries have done in reducing income inequality, none have been able to reduce it to a Gini Coefficient level of 0.2 or less.
This is the promise that a novel approach called Counterbalance Economics (CBE) provides without the need of increased taxes.
Based on the simulation, introducing the CBE into the Australian, UK, US, Swiss or German economies would result in an overall GDP increase of under 1% however, the level of inequality would be reduced from an average of 0.33 down to an average of 0.08. A detailed explanation of how to use the model, software, and data dependencies along with all other requirements have been included as part of the info tab in the model.
Holmestrand School Model
Jessica Dimka | Published Friday, June 18, 2021 | Last modified Friday, April 29, 2022The Holmestrand model is an epidemiological agent-based model. Its aim is to test hypotheses related to how the social and physical environment of a residential school for children with disabilities might influence the spread of an infectious disease epidemic among students and staff. Annual reports for the Holmestrand School for the Deaf (Norway) are the primary sources of inspiration for the modeled school, with additional insights drawn from other archival records for schools for children with disabilities in early 20th century Norway and data sources for the 1918 influenza pandemic. The model environment consists of a simplified boarding school that includes residential spaces for students and staff, classrooms, a dining room, common room, and an outdoor area. Students and staff engage in activities reflecting hourly schedules suggested by school reports. By default, a random staff member is selected as the first case and is infected with disease. Subsequent transmission is determined by agent movement and interactions between susceptible and infectious pairs.
Model of Rental Evictions in Phoenix During the Covid-19 Pandemic
Sean Bergin J M Applegate | Published Saturday, July 31, 2021 | Last modified Friday, October 15, 2021The purpose of this model is to explore the dynamics of residency and eviction for households renting in the greater Phoenix (Arizona) metropolitan area. The model uses a representative population of renters modified from American Community Survey (ACS) data that includes demographic, housing and economic information. Each month, households pay their subsistence, rental and utility bills. If a household is unable to pay their monthly rent or utility bill they apply for financial assistance. This model provides a platform to understand the impact of various economic shock upon households. Also, the model includes conditions that occurred as a result of the Covid-19 pandemic which allows for the study of eviction mitigation strategies that were employed, such as the eviction moratorium and stimulus payments. The model allows us to make preliminary predictions concerning the number of households that may be evicted once the moratorium on evictions ends and the long-term effects on the number of evicted households in the greater Phoenix area going forward.
Peer reviewed Correlated Random Walk (NetLogo)
Viktoriia Radchuk Uta Berger Thibault Fronville | Published Tuesday, May 09, 2023 | Last modified Monday, December 18, 2023This is NetLogo code that presents two alternative implementations of Correlated Random Walk (CRW):
- 1. drawing the turning angles from the uniform distribution, i.e. drawing the angle with the same probability from a certain given range;
- 2. drawing the turning angles from von Mises distribution.
The move lengths are drawn from the lognormal distribution with the specified parameters.
Correlated Random Walk is used to represent the movement of animal individuals in two-dimensional space. When modeled as CRW, the direction of movement at any time step is correlated with the direction of movement at the previous time step. Although originally used to describe the movement of insects, CRW was later shown to sufficiently well describe the empirical movement data of other animals, such as wild boars, caribous, sea stars.
…
MERCURY extension: population
Tom Brughmans | Published Thursday, May 23, 2019This model is an extended version of the original MERCURY model (https://www.comses.net/codebases/4347/releases/1.1.0/ ) . It allows for experiments to be performed in which empirically informed population sizes of sites are included, that allow for the scaling of the number of tableware traders with the population of settlements, and for hypothesised production centres of four tablewares to be used in experiments.
Experiments performed with this population extension and substantive interpretations derived from them are published in:
Hanson, J.W. & T. Brughmans. In press. Settlement scale and economic networks in the Roman Empire, in T. Brughmans & A.I. Wilson (ed.) Simulating Roman Economies. Theories, Methods and Computational Models. Oxford: Oxford University Press.
…
TechNet_04: Cultural Transmission in a Spatially-Situated Network
Andrew White | Published Monday, October 08, 2012 | Last modified Saturday, April 27, 2013The TechNet_04 is an abstract model that embeds a simple cultural tranmission process in an environment where interaction is structured by spatially-situated networks.
Model of communication between two groups of managers in the course of project implementation
Smarzhevskiy Ivan | Published Monday, December 07, 2020This is a simulation model of communication between two groups of managers in the course of project implementation. The “world” of the model is a space of interaction between project participants, each of which belongs either to a group of work performers or to a group of customers. Information about the progress of the project is publicly available and represents the deviation Earned value (EV) from the planned project value (cost baseline).
The key elements of the model are 1) persons belonging to a group of customers or performers, 2) agents that are communication acts. The life cycle of persons is equal to the time of the simulation experiment, the life cycle of the communication act is 3 periods of model time (for the convenience of visualizing behavior during the experiment). The communication act occurs at a specific point in the model space, the coordinates of which are realized as random variables. During the experiment, persons randomly move in the model space. The communication act involves persons belonging to a group of customers and a group of performers, remote from the place of the communication act at a distance not exceeding the value of the communication radius (MaxCommRadius), while at least one representative from each of the groups must participate in the communication act. If none are found, the communication act is not carried out. The number of potential communication acts per unit of model time is a parameter of the model (CommPerTick).
The managerial sense of the feedback is the stimulating effect of the positive value of the accumulated communication complexity (positive background of the project implementation) on the productivity of the performers. Provided there is favorable communication (“trust”, “mutual understanding”) between the customer and the contractor, it is more likely that project operations will be performed with less lag behind the plan or ahead of it.
The behavior of agents in the world of the model (change of coordinates, visualization of agents’ belonging to a specific communicative act at a given time, etc.) is not informative. Content data are obtained in the form of time series of accumulated communicative complexity, the deviation of the earned value from the planned value, average indicators characterizing communication - the total number of communicative acts and the average number of their participants, etc. These data are displayed on graphs during the simulation experiment.
The control elements of the model allow seven independent values to be varied, which, even with a minimum number of varied values (three: minimum, maximum, optimum), gives 3^7 = 2187 different variants of initial conditions. In this case, the statistical processing of the results requires repeated calculation of the model indicators for each grid node. Thus, the set of varied parameters and the range of their variation is determined by the logic of a particular study and represents a significant narrowing of the full set of initial conditions for which the model allows simulation experiments.
…
Epidemic Simulation with Transportation Simulation
FG Econophysics FG Econophysics | Published Monday, March 01, 2021The Episim framework builds upon the established transportation simulation MATSim and is capable of tracking agents’ movements within a network and thus computing infection chains. Several characteristics of the virus and the environment can be parametred, whilst the infection dynamics is computed based upon a compartment model. The spread of the virus can be mitigated by restricting the agents’ activity in certain places.
Forager mobility and interaction
L S Premo | Published Thursday, January 10, 2013 | Last modified Saturday, April 27, 2013This is a relatively simple foraging-radius model, as described first by Robert Kelly, that allows one to quantify the effect of increased logistical mobility (as represented by increased effective foraging radius, r_e) on the likelihood that 2 randomly placed central place foragers will encounter one another within 5000 time steps.
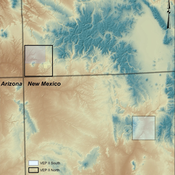
Village Ecodynamics Project
ipem | Published Friday, May 13, 2011 | Last modified Saturday, April 27, 2013The Village Project is designed to help archaeologists understand the factors influencing settlement patterns of small-scale agrarian peoples. Although such societies are becoming increasingly rare, they represent the norm throughout most of the Neolithic period the world over.
Displaying 10 of 212 results for "Dara Vancea" clear search