About the CoMSES Model Library more info
Our mission is to help computational modelers develop, document, and share their computational models in accordance with community standards and good open science and software engineering practices. Model authors can publish their model source code in the Computational Model Library with narrative documentation as well as metadata that supports open science and emerging norms that facilitate software citation, computational reproducibility / frictionless reuse, and interoperability. Model authors can also request private peer review of their computational models. Models that pass peer review receive a DOI once published.
All users of models published in the library must cite model authors when they use and benefit from their code.
Please check out our model publishing tutorial and feel free to contact us if you have any questions or concerns about publishing your model(s) in the Computational Model Library.
We also maintain a curated database of over 7500 publications of agent-based and individual based models with detailed metadata on availability of code and bibliometric information on the landscape of ABM/IBM publications that we welcome you to explore.
Displaying 10 of 345 results for "Tim Dorscheidt" clear search
Income Model
Tony Lawson | Published Monday, August 26, 2013This is the code for the model described in an article in the International Journal of Microsimulation. Lawson (2013) ‘Modelling Household Spending Using a Random Assignment Scheme’, International Journal of Microsimulation, 6(2) Autumn 2013, 56-75.
A Simulation of Entrepreneurial Spawning
Mark Bagley | Published Wednesday, June 08, 2016 | Last modified Friday, June 30, 2017Industrial clustering patterns are the result of an entrepreneurial process where spinoffs inherit the ideas and attributes of their parent firms. This computational model maps these patterns using abstract methodologies.
Armature distribution within the PaleoscapeABM
Claudine Gravel-Miguel | Published Tuesday, March 23, 2021This is a variant of the PaleoscapeABM model available here written by Wren and Janssen. In this variant, we give projectile weapons to hunter and document where they discard them over time. Discard rate and location are influenced by probabilities of hitting/missing the prey, probabilities of damaging the weapon, and probabilities of carrying back embedded projectile armatures to the habitation camp with the body carcass.
Bayesian Updating Opinion Shared Uncertainty Model.
Johnathan Adams | Published Monday, November 16, 2020 | Last modified Friday, May 14, 2021This is an opinion dynamics model which extends the model found in (Martins 2009). The previous model had an unshared uncertainty assumption in agent-to-agent interaction this model relaxes that assumption. The model only supports a fully connect network where every agent has an equal likelihood of interacting with every other agent at any given time step. The model is highly modular so different social network paradigm can easier be implemented.
An agent-based simulation of discussion processes in risk workshops
Matthias Meyer Clemens Harten Lucia Bellora-Bienengräber | Published Thursday, September 30, 2021The model measures drivers of effectiveness of risk assessments in risk workshops regarding the correctness and required time. Specifically, we model the limits to information transfer, incomplete discussions, group characteristics, and interaction patterns and investigate their effect on risk assessment in risk workshops.
The model simulates a discussion in the context of a risk workshop with 9 participants. The participants use Bayesian networks to assess a given risk individually and as a group.
BarterNet is a platform for modeling early barter networks with the aim of learning how supply and demand for a good determine if traders will learn to use that good as a form of money. Traders use a good as money when they offer to trade for it even if they can’t consume it, but believe that they can subsequently trade it for a good they can consume in the near future.
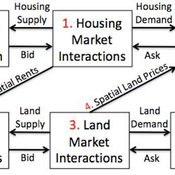
Coupled Housing and Land Markets (CHALMS)
Nicholas Magliocca Virginia Mcconnell Margaret Walls | Published Friday, November 02, 2012 | Last modified Monday, October 27, 2014CHALMS simulates housing and land market interactions between housing consumers, developers, and farmers in a growing ex-urban area.
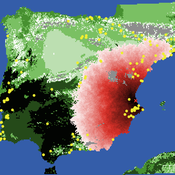
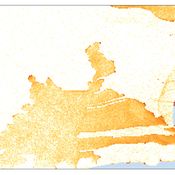
Neolithic Spread Model Version 1.0
Sean Bergin Salvador Pardo Gordo Joan Bernabeu Auban Michael Barton | Published Thursday, December 11, 2014 | Last modified Monday, December 31, 2018This model simulates different spread hypotheses proposed for the introduction of agriculture on the Iberian peninsula. We include three dispersal types: neighborhood, leapfrog, and ideal despotic distribution (IDD).
Simulating the Transmission of Foot-And-Mouth Disease Among Mobile Herds in the Far North Region, Cameroon
Mark Moritz Hyeyoung Kim Ningchuan Xiao Rebecca Garabed Laura W Pomeroy | Published Wednesday, April 13, 2016This model simulates movements of mobile pastoralists and their impacts on the transmission of foot-and-mouth disease (FMD) in the Far North Region of Cameroon.
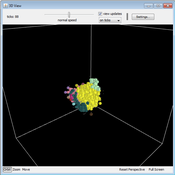
Ornstein-Uhlenbeck Pandemic package
Peter Cotton | Published Friday, April 24, 2020 | Last modified Friday, May 08, 2020Pandemic (pip install pandemic)
An agent model in which commuting, compliance, testing and contagion parameters drive infection in a population of thousands of millions. Agents follow Ornstein-Uhlenbeck processes in the plane and collisions drive transmission. Results are stored at SwarmPrediction.com for further analysis, and can be retrieved by anyone.
This is a very simple simulation that in a special case can be shown to be approximated by a compartmental model with time varying infection rate.
Displaying 10 of 345 results for "Tim Dorscheidt" clear search