About the CoMSES Model Library more info
Our mission is to help computational modelers at all levels engage in the establishment and adoption of community standards and good practices for developing and sharing computational models. Model authors can freely publish their model source code in the Computational Model Library alongside narrative documentation, open science metadata, and other emerging open science norms that facilitate software citation, reproducibility, interoperability, and reuse. Model authors can also request peer review of their computational models to receive a DOI.
All users of models published in the library must cite model authors when they use and benefit from their code.
Please check out our model publishing tutorial and contact us if you have any questions or concerns about publishing your model(s) in the Computational Model Library.
We also maintain a curated database of over 7500 publications of agent-based and individual based models with additional detailed metadata on availability of code and bibliometric information on the landscape of ABM/IBM publications that we welcome you to explore.
Displaying 10 of 115 results for "Nathan Ryan" clear search
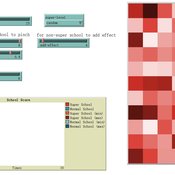
An agent-based model of school enrollment process under educational competition
Yao Tong | Published Sunday, August 04, 2024Due to the role of education in promoting social status and facilitating upward social mobility, individuals and their families spare no effort to pursue better educational opportunities, especially in countries where education is highly competitive.
In China, the enrollment of senior high schools and universities mainly follows a ranking system based on students’ scores in national entrance exams (Zhongkao and Gaokao). Typically, students with higher scores have priority in choosing schools and endeavor to get into better senior high schools to increase their chances of entering a prestigious university.
However, students can only select “better” senior high schools based on their average Gaokao grades, which are strongly influenced by the initial performance (Zhongkao grades) of enrolled students. The true quality indicator of school education (schooling effect, defined as the grade improvement achieved through education at the senior high school) is unknowable. This raises the first question: will school rankings reflect the real educational quality of schools over decades of educational competition, or merely the initial quality of the students they enroll?
…
The Travel-tour case study
Christophe Sibertin-Blanc Françoise Adreit Joseph El Gemayel | Published Sunday, May 19, 2013 | Last modified Friday, June 14, 2013This model describes and analyses the Travel-Tour Case study.
Soy2Grow-ABM-V1
Siavash Farahbakhsh | Published Monday, January 20, 2025The Soy2Grow ABM aims to simulate the adoption of soybean production in Flanders, Belgium. The model primarily considers two types of agents as farmers: 1) arable and 2) dairy farmers. Each farmer, based on its type, assesses the feasibility of adopting soybean cultivation. The feasibility assessment depends on many interrelated factors, including price, production costs, yield, disease, drought (i.e., environmental stress), social pressure, group formations, learning and skills, risk-taking, subsidies, target profit margins, tolerance to bad experiences, etc. Moreover, after adopting soybean production, agents will reassess their performance. If their performance is unsatisfactory, an agent may opt out of soy production. Therefore, one of the main outcomes to look for in the model is the number of adopters over time.
The main agents are farmers. Generally, factors influencing farmers’ decision-making are divided into seven main areas: 1) external environmental factors, 2) cooperation and learning (with slight differences depending on whether they are arable or dairy farmers), 3) crop-specific factors, 4) economics, 5) support frameworks, 6) behavioral factors, and 7) the role of mobile toasters (applicable only to dairy farmers).
Moreover, factors not only influence decision-making but also interact with each other. Specifically, external environmental factors (i.e., stress) will result in lower yield and quality (protein content). The reducing effect, identified during participatory workshops, can reach 50 %. Skills can grow and improve yield; however, their growth has a limit and follows different learning curves depending on how individualistic a farmer is. During participatory workshops, it was identified that, contrary to cooperative farmers, individualistic farmers may learn faster and reach their limits more quickly. Furthermore, subsidies directly affect revenues and profit margins; however, their impact may disappear when they are removed. In the case of dairy farmers, mobile toasters play an important role, adding toasting and processing costs to those producing soy for their animal feed consumption.
Last but not least, behavioral factors directly influence the final adoption decision. For example, high risk-taking farmers may adopt faster, whereas more conservative farmers may wait for their neighbors to adopt first. Farmers may evaluate their success based on their own targets and may also consider other crops rather than soy.
NarrABS
Tilman Schenk | Published Thursday, September 20, 2012 | Last modified Saturday, April 27, 2013An agent based simulation of a political process based on stakeholder narratives
Space colonization
allagonne | Published Wednesday, January 05, 2022Agent-Based-Modeling - space colonization
ask me for the .nlogo model
WHAT IS IT?
The goal of this project is to simulate with NetLogo (v6.2) a space colonization of humans, starting from Earth, into the Milky Way.
HOW IT WORKS
…
Linear Threshold
Kaushik Sarkar | Published Saturday, November 03, 2012 | Last modified Saturday, April 27, 2013NetLogo implementation of Linear Threshold model of influence propagation.
The Evolution of Multiple Resistant Strains: An Abstract Model of Systemic Treatment and Accumulated Resistance
Benjamin Nye | Published Wednesday, August 31, 2011 | Last modified Saturday, April 27, 2013This model is intended to explore the effectiveness of different courses of interventions on an abstract population of infections. Illustrative findings highlight the importance of the mechanisms for variability and mutation on the effectiveness of different interventions.
Universal Darwinism in Dutch Greenhouses
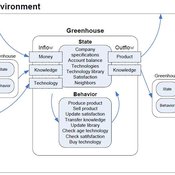
Julia Kasmire | Published Wednesday, May 09, 2012 | Last modified Saturday, April 27, 2013An ABM, derived from a case study and a series of surveys with greenhouse growers in the Westland, Netherlands. Experiments using this model showshow that the greenhouse horticulture industry displays diversity, adaptive complexity and an uneven distribution, which all suggest that the industry is an evolving system.
The various technologies used inside a Dutch greenhouse interact in combination with an external climate, resulting in an emergent internal climate, which contributes to the final productivity of the greenhouse. This model examines how differing technology development styles affects the overall ability of a community of growers to approach the theoretical maximum yield.
Model of communication between two groups of managers in the course of project implementation
Smarzhevskiy Ivan | Published Monday, December 07, 2020This is a simulation model of communication between two groups of managers in the course of project implementation. The “world” of the model is a space of interaction between project participants, each of which belongs either to a group of work performers or to a group of customers. Information about the progress of the project is publicly available and represents the deviation Earned value (EV) from the planned project value (cost baseline).
The key elements of the model are 1) persons belonging to a group of customers or performers, 2) agents that are communication acts. The life cycle of persons is equal to the time of the simulation experiment, the life cycle of the communication act is 3 periods of model time (for the convenience of visualizing behavior during the experiment). The communication act occurs at a specific point in the model space, the coordinates of which are realized as random variables. During the experiment, persons randomly move in the model space. The communication act involves persons belonging to a group of customers and a group of performers, remote from the place of the communication act at a distance not exceeding the value of the communication radius (MaxCommRadius), while at least one representative from each of the groups must participate in the communication act. If none are found, the communication act is not carried out. The number of potential communication acts per unit of model time is a parameter of the model (CommPerTick).
The managerial sense of the feedback is the stimulating effect of the positive value of the accumulated communication complexity (positive background of the project implementation) on the productivity of the performers. Provided there is favorable communication (“trust”, “mutual understanding”) between the customer and the contractor, it is more likely that project operations will be performed with less lag behind the plan or ahead of it.
The behavior of agents in the world of the model (change of coordinates, visualization of agents’ belonging to a specific communicative act at a given time, etc.) is not informative. Content data are obtained in the form of time series of accumulated communicative complexity, the deviation of the earned value from the planned value, average indicators characterizing communication - the total number of communicative acts and the average number of their participants, etc. These data are displayed on graphs during the simulation experiment.
The control elements of the model allow seven independent values to be varied, which, even with a minimum number of varied values (three: minimum, maximum, optimum), gives 3^7 = 2187 different variants of initial conditions. In this case, the statistical processing of the results requires repeated calculation of the model indicators for each grid node. Thus, the set of varied parameters and the range of their variation is determined by the logic of a particular study and represents a significant narrowing of the full set of initial conditions for which the model allows simulation experiments.
…
Displaying 10 of 115 results for "Nathan Ryan" clear search


