About the CoMSES Model Library more info
Our mission is to help computational modelers at all levels engage in the establishment and adoption of community standards and good practices for developing and sharing computational models. Model authors can freely publish their model source code in the Computational Model Library alongside narrative documentation, open science metadata, and other emerging open science norms that facilitate software citation, reproducibility, interoperability, and reuse. Model authors can also request peer review of their computational models to receive a DOI.
All users of models published in the library must cite model authors when they use and benefit from their code.
Please check out our model publishing tutorial and contact us if you have any questions or concerns about publishing your model(s) in the Computational Model Library.
We also maintain a curated database of over 7500 publications of agent-based and individual based models with additional detailed metadata on availability of code and bibliometric information on the landscape of ABM/IBM publications that we welcome you to explore.
Displaying 10 of 129 results for "Abraham Mawere Ndlovu" clear search
The Agent-Based Model of the Closed Market( similar to Stock Market) with One Commodity and with careful and risky mechanisms
Mark Voronovitsky | Published Sunday, March 15, 2015 | Last modified Sunday, March 22, 2015The model of market of one commodity , in which there are in each moment of time the same quantity and the same quantity of money was formulated and researched in this text. We also study this system as a game of automata.
Agent-based model of WiFi tracking system in urban environment
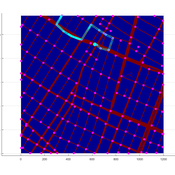
Christopher Thron Khoi Tran | Published Friday, April 21, 2017This code simulates the WiFi user tracking system described in: Thron et al., “Design and Simulation of Sensor Networks for Tracking Wifi Users in Outdoor Urban Environments”. Testbenches used to create the figures in the paper are included.
VIDA: A simulation model of domestic VIolence in times of social DistAncing
Bernardo Furtado | Published Monday, January 11, 2021Violence against women occurs predominantly in the family and domestic context. The COVID-19 pandemic led Brazil to recommend and, at times, impose social distancing, with the partial closure of economic activities, schools, and restrictions on events and public services. Preliminary evidence shows that intense co- existence increases domestic violence, while social distancing measures may have prevented access to public services and networks, information, and help. We propose an agent-based model (ABM), called VIDA, to illustrate and examine multi-causal factors that influence events that generate violence. A central part of the model is the multi-causal stress indicator, created as a probability trigger of domestic violence occurring within the family environment. Two experimental design tests were performed: (a) absence or presence of the deterrence system of domestic violence against women and measures to increase social distancing. VIDA presents comparative results for metropolitan regions and neighbourhoods considered in the experiments. Results suggest that social distancing measures, particularly those encouraging staying at home, may have increased domestic violence against women by about 10%. VIDA suggests further that more populated areas have comparatively fewer cases per hundred thousand women than less populous capitals or rural areas of urban concentrations. This paper contributes to the literature by formalising, to the best of our knowledge, the first model of domestic violence through agent-based modelling, using empirical detailed socioeconomic, demographic, educational, gender, and race data at the intraurban level (census sectors).
Peer reviewed Agent-based model to simulate equilibria and regime shifts emerged in lake ecosystems
no contributors listed | Published Tuesday, January 25, 2022(An empty output folder named “NETLOGOexperiment” in the same location with the LAKEOBS_MIX.nlogo file is required before the model can be run properly)
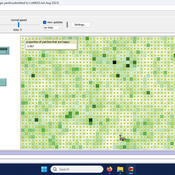
The model is motivated by regime shifts (i.e. abrupt and persistent transition) revealed in the previous paleoecological study of Taibai Lake. The aim of this model is to improve a general understanding of the mechanism of emergent nonlinear shifts in complex systems. Prelimnary calibration and validation is done against survey data in MLYB lakes. Dynamic population changes of function groups can be simulated and observed on the Netlogo interface.
Main functional groups in lake ecosystems were modelled as super-individuals in a space where they interact with each other. They are phytoplankton, zooplankton, submerged macrophyte, planktivorous fish, herbivorous fish and piscivorous fish. The relationships between these functional groups include predation (e.g. zooplankton-phytoplankton), competition (phytoplankton-macrophyte) and protection (macrophyte-zooplankton). Each individual has properties in size, mass, energy, and age as physiological variables and reproduce or die according to predefined criteria. A system dynamic model was integrated to simulate external drivers.
Set biological and environmental parameters using the green sliders first. If the data of simulation are to be logged, set “Logdata” as true and input the name of the file you want the spreadsheet(.csv) to be called. You will need create an empty folder called “NETLOGOexperiment” in the same level and location with the LAKEOBS_MIX.nlogo file. Press “setup” to initialise the system and “go” to start life cycles.
PalaeoDiet : Rabbit hunting during the Upper Palaeolithic
Samuel Seuru Liliana Perez Ariane Burke | Published Thursday, October 06, 2022Zooarchaeological evidences indicate that rabbit hunting became prevalent during the Upper Palaeolithic in the Iberian Peninsula.
The purpose of the ABM is to test if warren hunting using nets as a collective strategy can explain the introduction of rabbits in the human diet in the Iberian Peninsula during this period. It is analyzed whether this hunting strategy has an impact on human diet breadth by affecting the relative abundance of other main taxa in the dietary spectrum.
Model validity is measured by comparing simulated diet breadth to the observed diet breadth in the zooarchaeological record.
The agent-based model is explicitly grounded on the Diet Breadth Model (DBM), from the Optimal Foraging Theory (OFT).
…
ForagerNet3_Demography_V3
Andrew White | Published Tuesday, November 29, 2016The ForagerNet3_Demography model is a non-spatial ABM designed to serve as a platform for exploring several aspects of hunter-gatherer demography.
Location Analysis Hybrid ABM
Lukasz Kowalski | Published Friday, February 08, 2019The purpose of this hybrid ABM is to answer the question: where is the best place for a new swimming pool in a region of Krakow (in Poland)?
The model is well described in ODD protocol, that can be found in the end of my article published in JASSS journal (available online: http://jasss.soc.surrey.ac.uk/22/1/1.html ). Comparison of this kind of models with spatial interaction ones, is presented in the article. Before developing the model for different purposes, area of interest or services, I recommend reading ODD protocol and the article.
I published two films on YouTube that present the model: https://www.youtube.com/watch?v=iFWG2Xv20Ss , https://www.youtube.com/watch?v=tDTtcscyTdI&t=1s
…
This model extends the original Artifical Anasazi (AA) model to include individual agents, who vary in age and sex, and are aggregated into households. This allows more realistic simulations of population dynamics within the Long House Valley of Arizona from AD 800 to 1350 than are possible in the original model. The parts of this model that are directly derived from the AA model are based on Janssen’s 1999 Netlogo implementation of the model; the code for all extensions and adaptations in the model described here (the Artificial Long House Valley (ALHV) model) have been written by the authors. The AA model included only ideal and homogeneous “individuals” who do not participate in the population processes (e.g., birth and death)–these processes were assumed to act on entire households only. The ALHV model incorporates actual individual agents and all demographic processes affect these individuals. Individuals are aggregated into households that participate in annual agricultural and demographic cycles. Thus, the ALHV model is a combination of individual processes (birth and death) and household-level processes (e.g., finding suitable agriculture plots).
As is the case for the AA model, the ALHV model makes use of detailed archaeological and paleoenvironmental data from the Long House Valley and the adjacent areas in Arizona. It also uses the same methods as the original model (from Janssen’s Netlogo implementation) to estimate annual maize productivity of various agricultural zones within the valley. These estimates are used to determine suitable locations for households and farms during each year of the simulation.
Peer reviewed Yards
Emily Minor Soraida Garcia srailsback Philip Johnson | Published Thursday, November 02, 2023This is a model of plant communities in urban and suburban residential neighborhoods. These plant communities are of interest because they provide many benefits to human residents and also provide habitat for wildlife such as birds and pollinators. The model was designed to explore the social factors that create spatial patterns in biodiversity in yards and gardens. In particular, the model was originally developed to determine whether mimicry behaviors–-or neighbors copying each other’s yard design–-could produce observed spatial patterns in vegetation. Plant nurseries and socio-economic constraints were also added to the model as other potential sources of spatial patterns in plant communities.
The idea for the model was inspired by empirical patterns of spatial autocorrelation that have been observed in yard vegetation in Chicago, Illinois (USA), and other cities, where yards that are closer together are more similar than yards that are farther apart. The idea is further supported by literature that shows that people want their yards to fit into their neighborhood. Currently, the yard attribute of interest is the number of plant species, or species richness. Residents compare the richness of their yards to the richness of their neighbors’ yards. If a resident’s yard is too different from their neighbors, the resident will be unhappy and change their yard to make it more similar.
The model outputs information about the diversity and identity of plant species in each yard. This can be analyzed to look for spatial autocorrelation patterns in yard diversity and to explore relationships between mimicry behaviors, yard diversity, and larger scale diversity.
The Travel-tour case study
Christophe Sibertin-Blanc Françoise Adreit Joseph El Gemayel | Published Sunday, May 19, 2013 | Last modified Friday, June 14, 2013This model describes and analyses the Travel-Tour Case study.
Displaying 10 of 129 results for "Abraham Mawere Ndlovu" clear search


